
|
Dlocal Limited (DLO) DCF -Bewertung |
Fully Editable: Tailor To Your Needs In Excel Or Sheets
Professional Design: Trusted, Industry-Standard Templates
Investor-Approved Valuation Models
MAC/PC Compatible, Fully Unlocked
No Expertise Is Needed; Easy To Follow
DLocal Limited (DLO) Bundle
Möchten Sie den inneren Wert von Dlocal Limited bewerten? Unser DCF-Taschenrechner für DLO (DLO) integriert reale Daten mit umfangreichen Anpassungsfunktionen, sodass Sie Ihre Prognosen verfeinern und Ihre Investitionsauswahl verbessern können.
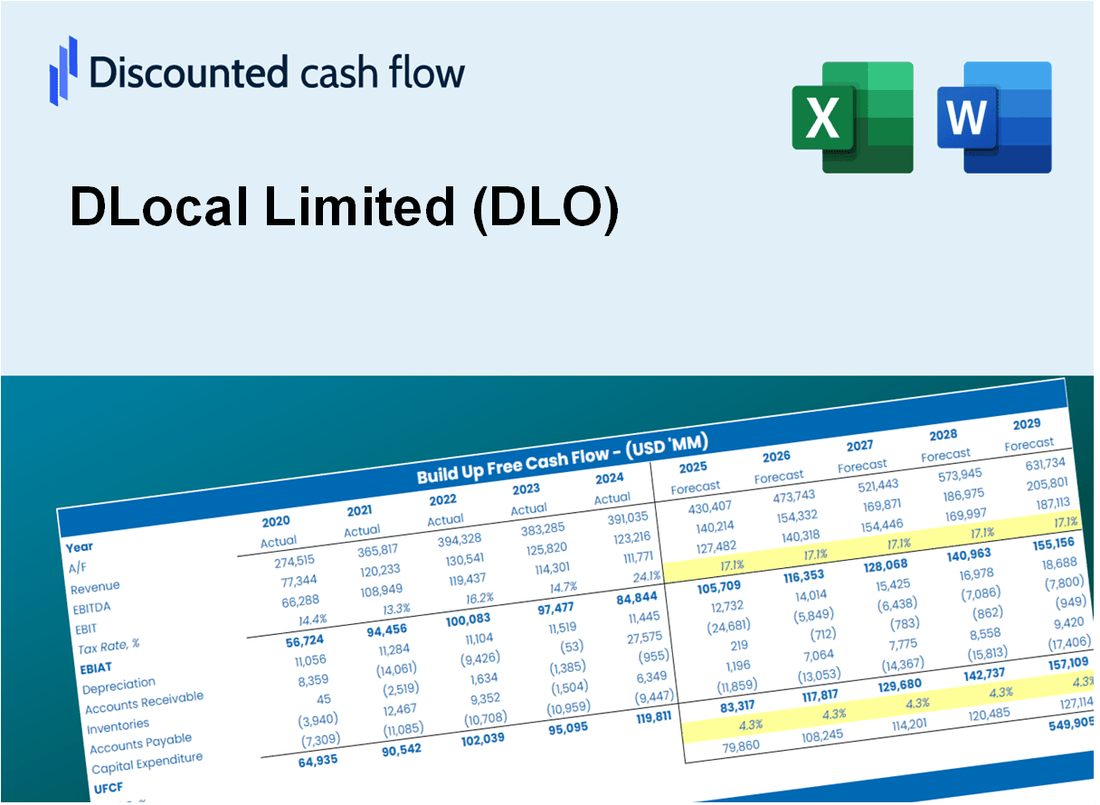
Discounted Cash Flow (DCF) - (USD MM)
| Year | AY1 2020 |
AY2 2021 |
AY3 2022 |
AY4 2023 |
AY5 2024 |
FY1 2025 |
FY2 2026 |
FY3 2027 |
FY4 2028 |
FY5 2029 |
|---|---|---|---|---|---|---|---|---|---|---|
| Revenue | 104.1 | 244.1 | 418.9 | 650.4 | 746.0 | 1,196.5 | 1,919.0 | 3,077.8 | 4,936.4 | 7,917.4 |
| Revenue Growth, % | 0 | 134.41 | 71.61 | 55.24 | 14.7 | 60.39 | 60.39 | 60.39 | 60.39 | 60.39 |
| EBITDA | 32.4 | 90.4 | 128.6 | 191.3 | 168.9 | 361.2 | 579.2 | 929.0 | 1,490.1 | 2,389.9 |
| EBITDA, % | 31.14 | 37.03 | 30.7 | 29.42 | 22.64 | 30.19 | 30.19 | 30.19 | 30.19 | 30.19 |
| Depreciation | 1.0 | 4.7 | 8.1 | 12.2 | 17.4 | 21.7 | 34.7 | 55.7 | 89.4 | 143.4 |
| Depreciation, % | 0.95254 | 1.94 | 1.94 | 1.88 | 2.33 | 1.81 | 1.81 | 1.81 | 1.81 | 1.81 |
| EBIT | 31.4 | 85.6 | 120.5 | 179.1 | 151.5 | 339.5 | 544.5 | 873.3 | 1,400.7 | 2,246.5 |
| EBIT, % | 30.19 | 35.08 | 28.75 | 27.54 | 20.31 | 28.37 | 28.37 | 28.37 | 28.37 | 28.37 |
| Total Cash | 52.0 | 337.2 | 469.4 | 325.5 | 566.1 | 899.4 | 1,442.6 | 2,313.7 | 3,710.9 | 5,951.9 |
| Total Cash, percent | .0 | .0 | .0 | .0 | .0 | .0 | .0 | .0 | .0 | .0 |
| Account Receivables | 67.2 | 191.0 | 240.4 | 319.5 | 457.2 | 743.2 | 1,191.9 | 1,911.7 | 3,066.2 | 4,917.8 |
| Account Receivables, % | 64.54 | 78.23 | 57.4 | 49.12 | 61.28 | 62.11 | 62.11 | 62.11 | 62.11 | 62.11 |
| Inventories | .0 | -1.0 | 1.2 | .0 | .0 | -.3 | -.5 | -.8 | -1.2 | -2.0 |
| Inventories, % | 0 | -0.41127 | 0.28788 | 0 | 0 | -0.02467869 | -0.02467869 | -0.02467869 | -0.02467869 | -0.02467869 |
| Accounts Payable | 136.7 | 269.2 | 395.1 | 572.4 | 562.7 | 1,095.4 | 1,756.9 | 2,817.9 | 4,519.5 | 7,248.8 |
| Accounts Payable, % | 131.29 | 110.28 | 94.32 | 88.01 | 75.44 | 91.55 | 91.55 | 91.55 | 91.55 | 91.55 |
| Capital Expenditure | -3.9 | -48.0 | -1.0 | -18.2 | -22.6 | -70.5 | -113.1 | -181.4 | -291.0 | -466.7 |
| Capital Expenditure, % | -3.73 | -19.67 | -0.2356 | -2.8 | -3.04 | -5.89 | -5.89 | -5.89 | -5.89 | -5.89 |
| Tax Rate, % | 20.26 | 20.26 | 20.26 | 20.26 | 20.26 | 20.26 | 20.26 | 20.26 | 20.26 | 20.26 |
| EBITAT | 28.2 | 78.0 | 108.8 | 149.4 | 120.8 | 294.9 | 473.0 | 758.6 | 1,216.7 | 1,951.5 |
| Depreciation | ||||||||||
| Changes in Account Receivables | ||||||||||
| Changes in Inventories | ||||||||||
| Changes in Accounts Payable | ||||||||||
| Capital Expenditure | ||||||||||
| UFCF | 94.8 | 44.5 | 190.2 | 242.9 | -31.8 | 493.0 | 607.5 | 974.4 | 1,562.8 | 2,506.5 |
| WACC, % | 9.88 | 9.89 | 9.88 | 9.8 | 9.76 | 9.84 | 9.84 | 9.84 | 9.84 | 9.84 |
| PV UFCF | ||||||||||
| SUM PV UFCF | 4,328.7 | |||||||||
| Long Term Growth Rate, % | 2.00 | |||||||||
| Free cash flow (T + 1) | 2,557 | |||||||||
| Terminal Value | 32,600 | |||||||||
| Present Terminal Value | 20,387 | |||||||||
| Enterprise Value | 24,716 | |||||||||
| Net Debt | -371 | |||||||||
| Equity Value | 25,087 | |||||||||
| Diluted Shares Outstanding, MM | 305 | |||||||||
| Equity Value Per Share | 82.22 |
What You Will Get
- Real DLO Financials: Access to historical and projected data for precise valuation.
- Customizable Inputs: Adjust WACC, tax rates, revenue growth, and capital expenditures as needed.
- Dynamic Calculations: Intrinsic value and NPV are computed automatically.
- Scenario Analysis: Explore various scenarios to assess DLocal's future performance.
- User-Friendly Design: Designed for professionals while remaining approachable for newcomers.
Key Features
- 🔍 Real-Life DLocal Financials: Pre-filled historical and projected data for DLocal Limited (DLO).
- ✏️ Fully Customizable Inputs: Adjust all critical parameters (yellow cells) like WACC, growth %, and tax rates.
- 📊 Professional DCF Valuation: Built-in formulas calculate DLocal’s intrinsic value using the Discounted Cash Flow method.
- ⚡ Instant Results: Visualize DLocal’s valuation instantly after making changes.
- Scenario Analysis: Test and compare outcomes for various financial assumptions side-by-side.
How It Works
- Step 1: Download the prebuilt Excel template featuring DLocal Limited's (DLO) data.
- Step 2: Navigate through the pre-filled sheets to familiarize yourself with the essential metrics.
- Step 3: Modify forecasts and assumptions in the editable yellow cells (WACC, growth, margins).
- Step 4: Instantly see the recalculated results, including DLocal Limited's (DLO) intrinsic value.
- Step 5: Utilize the outputs to make informed investment decisions or create detailed reports.
Why Choose This Calculator for DLocal Limited (DLO)?
- All-in-One Solution: Features DCF, WACC, and financial ratio analyses tailored for DLocal Limited.
- Flexible Inputs: Modify the highlighted cells to explore different financial scenarios.
- In-Depth Analysis: Automatically computes DLocal Limited’s intrinsic value and Net Present Value.
- Preloaded Information: Historical and projected data provide reliable starting points for analysis.
- High-Caliber Tool: Perfect for financial analysts, investors, and business consultants focusing on DLocal Limited.
Who Should Use This Product?
- Finance Students: Explore payment processing strategies and apply them to real-world scenarios using DLocal Limited (DLO) data.
- Academics: Utilize advanced models in your studies or research focused on cross-border payments.
- Investors: Evaluate your investment hypotheses and assess the performance metrics for DLocal Limited (DLO).
- Analysts: Enhance your analysis with a ready-to-use, adaptable financial model tailored for DLocal Limited (DLO).
- Small Business Owners: Understand how global payment solutions are structured and analyzed through the lens of DLocal Limited (DLO).
What the Template Contains
- Operating and Balance Sheet Data: Pre-filled DLocal Limited (DLO) historical data and forecasts, including revenue, EBITDA, EBIT, and capital expenditures.
- WACC Calculation: A dedicated sheet for Weighted Average Cost of Capital (WACC), featuring parameters such as Beta, risk-free rate, and share price.
- DCF Valuation (Unlevered and Levered): Editable Discounted Cash Flow models demonstrating intrinsic value with comprehensive calculations.
- Financial Statements: Pre-loaded financial statements (annual and quarterly) to facilitate analysis.
- Key Ratios: Includes profitability, leverage, and efficiency ratios for DLocal Limited (DLO).
- Dashboard and Charts: Visual summary of valuation outputs and assumptions to simplify result analysis.
Disclaimer
All information, articles, and product details provided on this website are for general informational and educational purposes only. We do not claim any ownership over, nor do we intend to infringe upon, any trademarks, copyrights, logos, brand names, or other intellectual property mentioned or depicted on this site. Such intellectual property remains the property of its respective owners, and any references here are made solely for identification or informational purposes, without implying any affiliation, endorsement, or partnership.
We make no representations or warranties, express or implied, regarding the accuracy, completeness, or suitability of any content or products presented. Nothing on this website should be construed as legal, tax, investment, financial, medical, or other professional advice. In addition, no part of this site—including articles or product references—constitutes a solicitation, recommendation, endorsement, advertisement, or offer to buy or sell any securities, franchises, or other financial instruments, particularly in jurisdictions where such activity would be unlawful.
All content is of a general nature and may not address the specific circumstances of any individual or entity. It is not a substitute for professional advice or services. Any actions you take based on the information provided here are strictly at your own risk. You accept full responsibility for any decisions or outcomes arising from your use of this website and agree to release us from any liability in connection with your use of, or reliance upon, the content or products found herein.