
|
Deluxe Corporation (DLX) DCF -Bewertung |
Fully Editable: Tailor To Your Needs In Excel Or Sheets
Professional Design: Trusted, Industry-Standard Templates
Investor-Approved Valuation Models
MAC/PC Compatible, Fully Unlocked
No Expertise Is Needed; Easy To Follow
Deluxe Corporation (DLX) Bundle
Verbessern Sie Ihre Anlagestrategien mit dem DCF -Taschenrechner Deluxe Corporation (DLX)! Verwenden Sie genaue Finanzdaten, passen Sie Wachstumsprojektionen und -kosten an und erleben Sie die unmittelbaren Auswirkungen auf den inneren Wert der Deluxe Corporation.
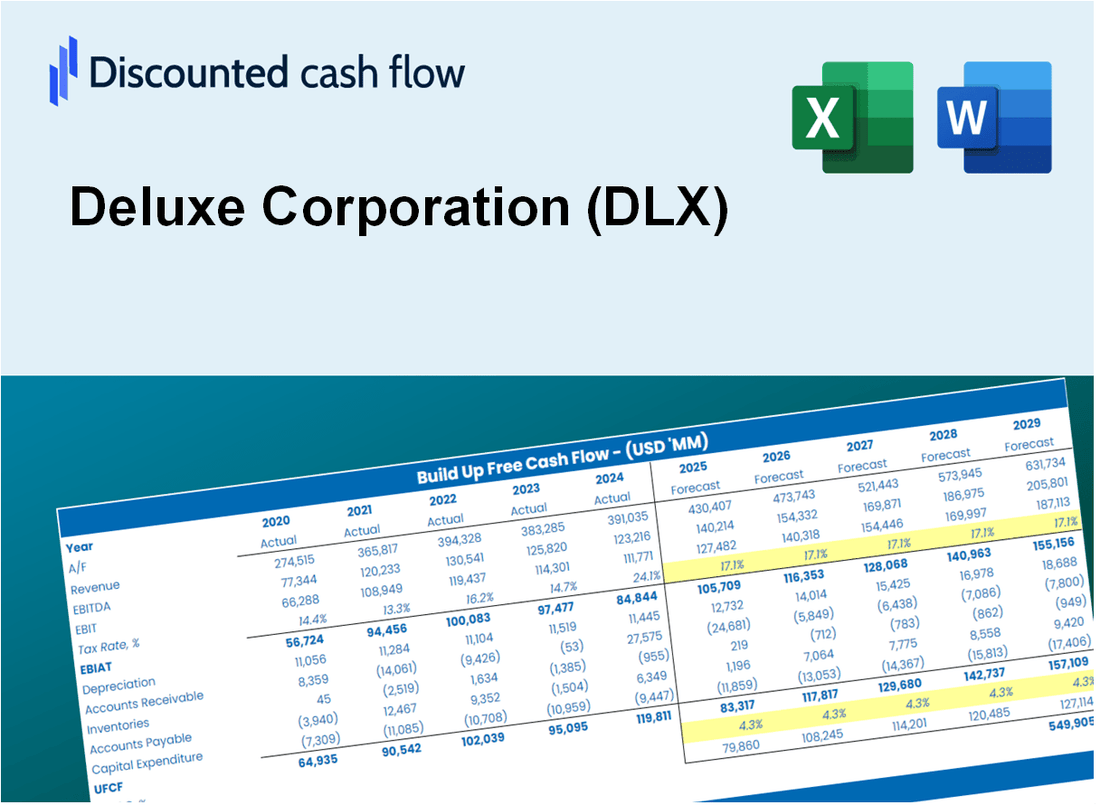
Discounted Cash Flow (DCF) - (USD MM)
| Year | AY1 2020 |
AY2 2021 |
AY3 2022 |
AY4 2023 |
AY5 2024 |
FY1 2025 |
FY2 2026 |
FY3 2027 |
FY4 2028 |
FY5 2029 |
|---|---|---|---|---|---|---|---|---|---|---|
| Revenue | 1,790.8 | 2,022.2 | 2,238.0 | 2,192.3 | 2,121.8 | 2,219.0 | 2,320.7 | 2,427.1 | 2,538.3 | 2,654.7 |
| Revenue Growth, % | 0 | 12.92 | 10.67 | -2.04 | -3.22 | 4.58 | 4.58 | 4.58 | 4.58 | 4.58 |
| EBITDA | 159.8 | 368.6 | 386.5 | 338.4 | 365.3 | 342.0 | 357.7 | 374.1 | 391.2 | 409.2 |
| EBITDA, % | 8.92 | 18.23 | 17.27 | 15.43 | 17.22 | 15.41 | 15.41 | 15.41 | 15.41 | 15.41 |
| Depreciation | 110.8 | 148.8 | 172.6 | 169.7 | 165.5 | 163.3 | 170.8 | 178.6 | 186.8 | 195.4 |
| Depreciation, % | 6.19 | 7.36 | 7.71 | 7.74 | 7.8 | 7.36 | 7.36 | 7.36 | 7.36 | 7.36 |
| EBIT | 49.0 | 219.8 | 213.9 | 168.7 | 199.8 | 178.7 | 186.9 | 195.5 | 204.5 | 213.8 |
| EBIT, % | 2.73 | 10.87 | 9.56 | 7.69 | 9.42 | 8.05 | 8.05 | 8.05 | 8.05 | 8.05 |
| Total Cash | 123.1 | 41.2 | 40.4 | 72.0 | 34.4 | 69.3 | 72.5 | 75.8 | 79.3 | 82.9 |
| Total Cash, percent | .0 | .0 | .0 | .0 | .0 | .0 | .0 | .0 | .0 | .0 |
| Account Receivables | 179.6 | 228.3 | 245.4 | 217.1 | 200.8 | 229.2 | 239.7 | 250.7 | 262.2 | 274.2 |
| Account Receivables, % | 10.03 | 11.29 | 10.96 | 9.9 | 9.46 | 10.33 | 10.33 | 10.33 | 10.33 | 10.33 |
| Inventories | 40.1 | 34.9 | 52.3 | 42.1 | 36.4 | 44.1 | 46.1 | 48.2 | 50.5 | 52.8 |
| Inventories, % | 2.24 | 1.73 | 2.34 | 1.92 | 1.72 | 1.99 | 1.99 | 1.99 | 1.99 | 1.99 |
| Accounts Payable | 117.0 | 153.1 | 157.1 | 154.9 | 164.9 | 159.6 | 166.9 | 174.5 | 182.5 | 190.9 |
| Accounts Payable, % | 6.53 | 7.57 | 7.02 | 7.06 | 7.77 | 7.19 | 7.19 | 7.19 | 7.19 | 7.19 |
| Capital Expenditure | -62.6 | -109.1 | -104.6 | -100.7 | -94.4 | -100.3 | -104.9 | -109.7 | -114.8 | -120.0 |
| Capital Expenditure, % | -3.5 | -5.4 | -4.67 | -4.6 | -4.45 | -4.52 | -4.52 | -4.52 | -4.52 | -4.52 |
| Tax Rate, % | 30.98 | 30.98 | 30.98 | 30.98 | 30.98 | 30.98 | 30.98 | 30.98 | 30.98 | 30.98 |
| EBITAT | 14.1 | 146.8 | 165.7 | 110.7 | 137.9 | 110.0 | 115.0 | 120.3 | 125.8 | 131.6 |
| Depreciation | ||||||||||
| Changes in Account Receivables | ||||||||||
| Changes in Inventories | ||||||||||
| Changes in Accounts Payable | ||||||||||
| Capital Expenditure | ||||||||||
| UFCF | -40.4 | 179.0 | 203.3 | 215.9 | 241.0 | 131.5 | 175.7 | 183.7 | 192.1 | 200.9 |
| WACC, % | 5.09 | 7.05 | 7.59 | 6.99 | 7.16 | 6.78 | 6.78 | 6.78 | 6.78 | 6.78 |
| PV UFCF | ||||||||||
| SUM PV UFCF | 720.7 | |||||||||
| Long Term Growth Rate, % | 1.00 | |||||||||
| Free cash flow (T + 1) | 203 | |||||||||
| Terminal Value | 3,513 | |||||||||
| Present Terminal Value | 2,531 | |||||||||
| Enterprise Value | 3,252 | |||||||||
| Net Debt | 1,558 | |||||||||
| Equity Value | 1,694 | |||||||||
| Diluted Shares Outstanding, MM | 45 | |||||||||
| Equity Value Per Share | 37.88 |
What You Will Get
- Editable Forecast Inputs: Easily adjust assumptions (growth %, margins, WACC) to explore various scenarios.
- Real-World Data: Deluxe Corporation’s financial data pre-filled to kickstart your analysis.
- Automatic DCF Outputs: The template computes Net Present Value (NPV) and intrinsic value automatically.
- Customizable and Professional: A refined Excel model that caters to your valuation requirements.
- Built for Analysts and Investors: Perfect for evaluating projections, confirming strategies, and enhancing efficiency.
Key Features
- Authentic Deluxe Financials: Gain access to reliable pre-loaded historical data and future forecasts.
- Adjustable Forecast Parameters: Modify yellow-highlighted cells such as WACC, growth rates, and profit margins.
- Real-Time Calculations: Automatic updates for DCF, Net Present Value (NPV), and cash flow assessments.
- Interactive Dashboard: Clear and concise charts and summaries to illustrate your valuation findings.
- Designed for All Levels: An easy-to-navigate layout tailored for investors, CFOs, and consultants alike.
How It Works
- Download the Template: Gain immediate access to the Excel-based DLX DCF Calculator.
- Input Your Assumptions: Modify the yellow-highlighted cells for growth rates, WACC, margins, and additional factors.
- Instant Calculations: The model automatically recalculates Deluxe Corporation’s intrinsic value.
- Test Scenarios: Experiment with various assumptions to assess potential changes in valuation.
- Analyze and Decide: Utilize the outcomes to inform your investment or financial analysis.
Why Choose This Calculator?
- Comprehensive Tool: Integrates DCF, WACC, and financial ratio analyses for thorough evaluations.
- Customizable Inputs: Modify yellow-highlighted cells to explore different scenarios.
- Detailed Insights: Automatically computes Deluxe Corporation’s intrinsic value and Net Present Value.
- Preloaded Data: Historical and projected data provide reliable starting points for analysis.
- Professional Quality: Perfect for financial analysts, investors, and business consultants focused on (DLX).
Who Should Use This Product?
- Investors: Evaluate Deluxe Corporation’s valuation before making investment decisions.
- CFOs and Financial Analysts: Optimize valuation methodologies and assess financial forecasts.
- Startup Founders: Understand how established companies like Deluxe Corporation are appraised.
- Consultants: Provide detailed valuation analyses and reports for clients.
- Students and Educators: Utilize current data to practice and teach valuation principles.
What the Template Contains
- Historical Data: Includes Deluxe Corporation’s past financials and baseline forecasts.
- DCF and Levered DCF Models: Detailed templates to calculate Deluxe Corporation’s intrinsic value.
- WACC Sheet: Pre-built calculations for Weighted Average Cost of Capital.
- Editable Inputs: Modify key drivers like growth rates, EBITDA %, and CAPEX assumptions.
- Quarterly and Annual Statements: A complete breakdown of Deluxe Corporation’s financials.
- Interactive Dashboard: Visualize valuation results and projections dynamically.
Disclaimer
All information, articles, and product details provided on this website are for general informational and educational purposes only. We do not claim any ownership over, nor do we intend to infringe upon, any trademarks, copyrights, logos, brand names, or other intellectual property mentioned or depicted on this site. Such intellectual property remains the property of its respective owners, and any references here are made solely for identification or informational purposes, without implying any affiliation, endorsement, or partnership.
We make no representations or warranties, express or implied, regarding the accuracy, completeness, or suitability of any content or products presented. Nothing on this website should be construed as legal, tax, investment, financial, medical, or other professional advice. In addition, no part of this site—including articles or product references—constitutes a solicitation, recommendation, endorsement, advertisement, or offer to buy or sell any securities, franchises, or other financial instruments, particularly in jurisdictions where such activity would be unlawful.
All content is of a general nature and may not address the specific circumstances of any individual or entity. It is not a substitute for professional advice or services. Any actions you take based on the information provided here are strictly at your own risk. You accept full responsibility for any decisions or outcomes arising from your use of this website and agree to release us from any liability in connection with your use of, or reliance upon, the content or products found herein.