
|
Dunelm Group Plc (DNLM.L) DCF -Bewertung |
Fully Editable: Tailor To Your Needs In Excel Or Sheets
Professional Design: Trusted, Industry-Standard Templates
Investor-Approved Valuation Models
MAC/PC Compatible, Fully Unlocked
No Expertise Is Needed; Easy To Follow
Dunelm Group plc (DNLM.L) Bundle
Entdecken Sie das finanzielle Potenzial von Dunelm Group Plc (DNLML) mit unserem benutzerfreundlichen DCF-Taschenrechner! Geben Sie Ihre Prognosen für Wachstum, Margen und Ausgaben ein, um den inneren Wert der Dunelm Group PLC (DNLML) zu bestimmen und verbessern Sie Ihren Investitionsansatz.
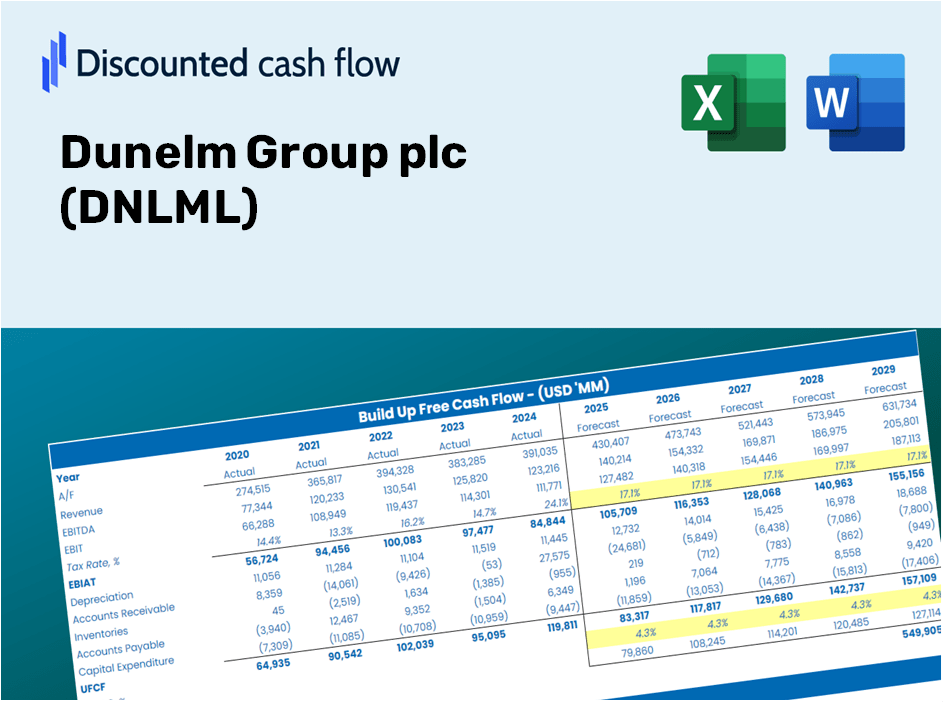
Discounted Cash Flow (DCF) - (USD MM)
| Year | AY1 2021 |
AY2 2022 |
AY3 2023 |
AY4 2024 |
AY5 2025 |
FY1 2026 |
FY2 2027 |
FY3 2028 |
FY4 2029 |
FY5 2030 |
|---|---|---|---|---|---|---|---|---|---|---|
| Revenue | 1,336.2 | 1,581.4 | 1,638.8 | 1,706.5 | 1,771.0 | 1,903.3 | 2,045.6 | 2,198.4 | 2,362.7 | 2,539.3 |
| Revenue Growth, % | 0 | 18.35 | 3.63 | 4.13 | 3.78 | 7.47 | 7.47 | 7.47 | 7.47 | 7.47 |
| EBITDA | 241.6 | 297.1 | 278.2 | 295.9 | 251.2 | 325.0 | 349.3 | 375.4 | 403.4 | 433.5 |
| EBITDA, % | 18.08 | 18.79 | 16.98 | 17.34 | 14.18 | 17.07 | 17.07 | 17.07 | 17.07 | 17.07 |
| Depreciation | 77.5 | 79.1 | 79.1 | 80.6 | 29.2 | 83.7 | 90.0 | 96.7 | 104.0 | 111.7 |
| Depreciation, % | 5.8 | 5 | 4.83 | 4.72 | 1.65 | 4.4 | 4.4 | 4.4 | 4.4 | 4.4 |
| EBIT | 164.1 | 218.0 | 199.1 | 215.3 | 222.0 | 241.2 | 259.2 | 278.6 | 299.4 | 321.8 |
| EBIT, % | 12.28 | 13.79 | 12.15 | 12.62 | 12.54 | 12.67 | 12.67 | 12.67 | 12.67 | 12.67 |
| Total Cash | 128.6 | 30.2 | 46.3 | 23.4 | 30.0 | 66.3 | 71.3 | 76.6 | 82.3 | 88.5 |
| Total Cash, percent | .0 | .0 | .0 | .0 | .0 | .0 | .0 | .0 | .0 | .0 |
| Account Receivables | 14.2 | 24.0 | 24.3 | 26.2 | 9.6 | 23.4 | 25.1 | 27.0 | 29.0 | 31.2 |
| Account Receivables, % | 1.06 | 1.52 | 1.48 | 1.54 | 0.54207 | 1.23 | 1.23 | 1.23 | 1.23 | 1.23 |
| Inventories | 172.4 | 223.0 | 211.0 | 223.0 | 226.3 | 250.2 | 268.9 | 289.0 | 310.6 | 333.8 |
| Inventories, % | 12.9 | 14.1 | 12.88 | 13.07 | 12.78 | 13.14 | 13.14 | 13.14 | 13.14 | 13.14 |
| Accounts Payable | 69.4 | 98.3 | 94.6 | 92.3 | 93.7 | 106.1 | 114.1 | 122.6 | 131.8 | 141.6 |
| Accounts Payable, % | 5.19 | 6.22 | 5.77 | 5.41 | 5.29 | 5.58 | 5.58 | 5.58 | 5.58 | 5.58 |
| Capital Expenditure | -15.7 | -24.0 | -21.8 | -32.4 | -35.2 | -30.1 | -32.4 | -34.8 | -37.4 | -40.2 |
| Capital Expenditure, % | -1.17 | -1.52 | -1.33 | -1.9 | -1.99 | -1.58 | -1.58 | -1.58 | -1.58 | -1.58 |
| Tax Rate, % | 25.92 | 25.92 | 25.92 | 25.92 | 25.92 | 25.92 | 25.92 | 25.92 | 25.92 | 25.92 |
| EBITAT | 134.0 | 175.4 | 156.9 | 158.5 | 164.4 | 187.5 | 201.5 | 216.6 | 232.8 | 250.1 |
| Depreciation | ||||||||||
| Changes in Account Receivables | ||||||||||
| Changes in Inventories | ||||||||||
| Changes in Accounts Payable | ||||||||||
| Capital Expenditure | ||||||||||
| UFCF | 78.6 | 199.0 | 222.2 | 190.5 | 173.1 | 215.9 | 246.7 | 265.1 | 284.9 | 306.2 |
| WACC, % | 6.7 | 6.69 | 6.68 | 6.65 | 6.66 | 6.68 | 6.68 | 6.68 | 6.68 | 6.68 |
| PV UFCF | ||||||||||
| SUM PV UFCF | 1,079.1 | |||||||||
| Long Term Growth Rate, % | 2.00 | |||||||||
| Free cash flow (T + 1) | 312 | |||||||||
| Terminal Value | 6,678 | |||||||||
| Present Terminal Value | 4,834 | |||||||||
| Enterprise Value | 5,913 | |||||||||
| Net Debt | 348 | |||||||||
| Equity Value | 5,565 | |||||||||
| Diluted Shares Outstanding, MM | 203 | |||||||||
| Equity Value Per Share | 2,736.35 |
What You Will Receive
- Genuine Dunelm Data: Preloaded financials – spanning revenue to EBIT – sourced from actual and projected figures.
- Comprehensive Customization: Modify all key parameters (yellow cells) such as WACC, growth %, and tax rates to fit your analysis.
- Immediate Valuation Adjustments: Automatic recalculations to assess the impact of changes on Dunelm's fair value.
- Flexible Excel Template: Designed for quick adjustments, scenario simulations, and in-depth projections.
- Efficient and Precise: Avoid building models from the ground up while ensuring accuracy and adaptability.
Key Features
- Pre-Loaded Data: Dunelm’s historical financial statements and pre-set forecasts.
- Fully Customizable Inputs: Modify WACC, tax rates, revenue growth, and EBITDA margins.
- Real-Time Results: Watch Dunelm’s intrinsic value recalculate instantly.
- Visual Data Representation: Dashboard graphs showcase valuation results and essential metrics.
- Designed for Precision: A reliable tool for analysts, investors, and finance professionals.
How It Works
- Download: Obtain the user-friendly Excel file featuring Dunelm Group plc’s (DNLML) financial data.
- Customize: Tailor your projections by modifying revenue growth, EBITDA %, and WACC to suit your analysis.
- Update Automatically: Watch as intrinsic value and NPV calculations refresh in real-time as you make changes.
- Test Scenarios: Generate various forecasts and instantly assess different outcomes.
- Make Decisions: Leverage the valuation insights to inform your investment strategies.
Why Choose This Calculator for Dunelm Group plc (DNLML)?
- User-Friendly Interface: Suitable for both novice users and seasoned professionals.
- Customizable Inputs: Easily adjust parameters to enhance your financial assessment.
- Real-Time Valuation: Observe immediate updates to Dunelm's valuation as you modify inputs.
- Pre-Configured Data: Comes with Dunelm's current financial metrics for swift analysis.
- Preferred by Experts: Widely utilized by investors and analysts for making educated choices.
Who Can Benefit from This Product?
- Institutional Investors: Develop comprehensive and accurate valuation models for analyzing portfolios involving Dunelm Group plc (DNLML).
- Corporate Finance Teams: Evaluate valuation scenarios to inform strategic decisions within the organization.
- Consultants and Financial Advisors: Deliver precise valuation insights to clients regarding Dunelm Group plc (DNLML).
- Students and Educators: Utilize real market data to enhance learning and practice in financial modeling.
- Home Retail Enthusiasts: Gain insights into how retail companies like Dunelm Group plc (DNLML) are valued within the industry.
Contents of the Template
- Comprehensive DCF Model: Editable template featuring detailed valuation calculations.
- Real-World Data: Dunelm Group plc’s (DNLML) historical and projected financials preloaded for your analysis.
- Customizable Parameters: Modify WACC, growth rates, and tax assumptions to explore various scenarios.
- Financial Statements: Complete annual and quarterly breakdowns for enhanced insights.
- Key Ratios: Integrated analysis for profitability, efficiency, and leverage metrics.
- Dashboard with Visual Outputs: Charts and tables presenting clear, actionable results.
Disclaimer
All information, articles, and product details provided on this website are for general informational and educational purposes only. We do not claim any ownership over, nor do we intend to infringe upon, any trademarks, copyrights, logos, brand names, or other intellectual property mentioned or depicted on this site. Such intellectual property remains the property of its respective owners, and any references here are made solely for identification or informational purposes, without implying any affiliation, endorsement, or partnership.
We make no representations or warranties, express or implied, regarding the accuracy, completeness, or suitability of any content or products presented. Nothing on this website should be construed as legal, tax, investment, financial, medical, or other professional advice. In addition, no part of this site—including articles or product references—constitutes a solicitation, recommendation, endorsement, advertisement, or offer to buy or sell any securities, franchises, or other financial instruments, particularly in jurisdictions where such activity would be unlawful.
All content is of a general nature and may not address the specific circumstances of any individual or entity. It is not a substitute for professional advice or services. Any actions you take based on the information provided here are strictly at your own risk. You accept full responsibility for any decisions or outcomes arising from your use of this website and agree to release us from any liability in connection with your use of, or reliance upon, the content or products found herein.