
|
Digitalocean Holdings, Inc. (DOCN) DCF -Bewertung |
Fully Editable: Tailor To Your Needs In Excel Or Sheets
Professional Design: Trusted, Industry-Standard Templates
Investor-Approved Valuation Models
MAC/PC Compatible, Fully Unlocked
No Expertise Is Needed; Easy To Follow
DigitalOcean Holdings, Inc. (DOCN) Bundle
Vereinfachen Sie die Bewertung digitalocean Holdings, Inc. (DOCN) mit diesem anpassbaren DCF -Taschenrechner! Mit Real Digitalocean Holdings, Inc. (DOCN) Finanzdaten und einstellbaren Prognoseeingaben können Sie Szenarien testen und Digitalocean Holdings, Inc. (DOCN) in Minuten aufdecken.
Discounted Cash Flow (DCF) - (USD MM)
| Year | AY1 2020 |
AY2 2021 |
AY3 2022 |
AY4 2023 |
AY5 2024 |
FY1 2025 |
FY2 2026 |
FY3 2027 |
FY4 2028 |
FY5 2029 |
|---|---|---|---|---|---|---|---|---|---|---|
| Revenue | 318.4 | 428.6 | 576.3 | 692.9 | 780.6 | 979.6 | 1,229.4 | 1,542.7 | 1,936.0 | 2,429.6 |
| Revenue Growth, % | 0 | 34.61 | 34.48 | 20.23 | 12.66 | 25.49 | 25.49 | 25.49 | 25.49 | 25.49 |
| EBITDA | 46.5 | 73.9 | 86.7 | 153.6 | 236.9 | 194.8 | 244.4 | 306.8 | 385.0 | 483.1 |
| EBITDA, % | 14.61 | 17.25 | 15.05 | 22.17 | 30.34 | 19.88 | 19.88 | 19.88 | 19.88 | 19.88 |
| Depreciation | 75.6 | 88.4 | 102.2 | 117.9 | 130.1 | 187.6 | 235.5 | 295.5 | 370.8 | 465.4 |
| Depreciation, % | 23.74 | 20.62 | 17.74 | 17.01 | 16.66 | 19.15 | 19.15 | 19.15 | 19.15 | 19.15 |
| EBIT | -29.0 | -14.5 | -15.5 | 35.7 | 106.8 | 7.2 | 9.0 | 11.3 | 14.1 | 17.8 |
| EBIT, % | -9.12 | -3.37 | -2.69 | 5.16 | 13.68 | 0.73083 | 0.73083 | 0.73083 | 0.73083 | 0.73083 |
| Total Cash | 100.3 | 1,713.4 | 864.2 | 411.8 | 428.4 | 677.5 | 850.3 | 1,067.0 | 1,339.0 | 1,680.4 |
| Total Cash, percent | .0 | .0 | .0 | .0 | .0 | .0 | .0 | .0 | .0 | .0 |
| Account Receivables | 28.1 | 39.6 | 53.8 | 62.2 | 91.1 | 94.2 | 118.2 | 148.3 | 186.1 | 233.5 |
| Account Receivables, % | 8.83 | 9.24 | 9.34 | 8.97 | 11.67 | 9.61 | 9.61 | 9.61 | 9.61 | 9.61 |
| Inventories | .0 | .0 | .0 | .0 | .0 | .0 | .0 | .0 | .0 | .0 |
| Inventories, % | 0 | 0 | 0 | 0 | 0 | 0 | 0 | 0 | 0 | 0 |
| Accounts Payable | 12.4 | 12.7 | 21.1 | 4.0 | 54.6 | 35.4 | 44.5 | 55.8 | 70.0 | 87.9 |
| Accounts Payable, % | 3.91 | 2.95 | 3.67 | 0.57109 | 6.99 | 3.62 | 3.62 | 3.62 | 3.62 | 3.62 |
| Capital Expenditure | -115.7 | -109.1 | -120.2 | -124.8 | -186.5 | -244.0 | -306.2 | -384.3 | -482.3 | -605.2 |
| Capital Expenditure, % | -36.33 | -25.46 | -20.86 | -18.01 | -23.89 | -24.91 | -24.91 | -24.91 | -24.91 | -24.91 |
| Tax Rate, % | 13.52 | 13.52 | 13.52 | 13.52 | 13.52 | 13.52 | 13.52 | 13.52 | 13.52 | 13.52 |
| EBITAT | -29.7 | -15.5 | -18.0 | 25.9 | 92.4 | 6.6 | 8.2 | 10.3 | 13.0 | 16.3 |
| Depreciation | ||||||||||
| Changes in Account Receivables | ||||||||||
| Changes in Inventories | ||||||||||
| Changes in Accounts Payable | ||||||||||
| Capital Expenditure | ||||||||||
| UFCF | -85.4 | -47.5 | -41.7 | -6.6 | 57.6 | -72.0 | -77.5 | -97.3 | -122.0 | -153.2 |
| WACC, % | 9.78 | 9.78 | 9.78 | 9.49 | 9.63 | 9.69 | 9.69 | 9.69 | 9.69 | 9.69 |
| PV UFCF | ||||||||||
| SUM PV UFCF | -384.5 | |||||||||
| Long Term Growth Rate, % | 2.00 | |||||||||
| Free cash flow (T + 1) | -156 | |||||||||
| Terminal Value | -2,032 | |||||||||
| Present Terminal Value | -1,280 | |||||||||
| Enterprise Value | -1,664 | |||||||||
| Net Debt | 1,267 | |||||||||
| Equity Value | -2,931 | |||||||||
| Diluted Shares Outstanding, MM | 95 | |||||||||
| Equity Value Per Share | -31.01 |
What You Will Get
- Editable Excel Template: A fully customizable Excel-based DCF Calculator featuring pre-filled real DOCN financials.
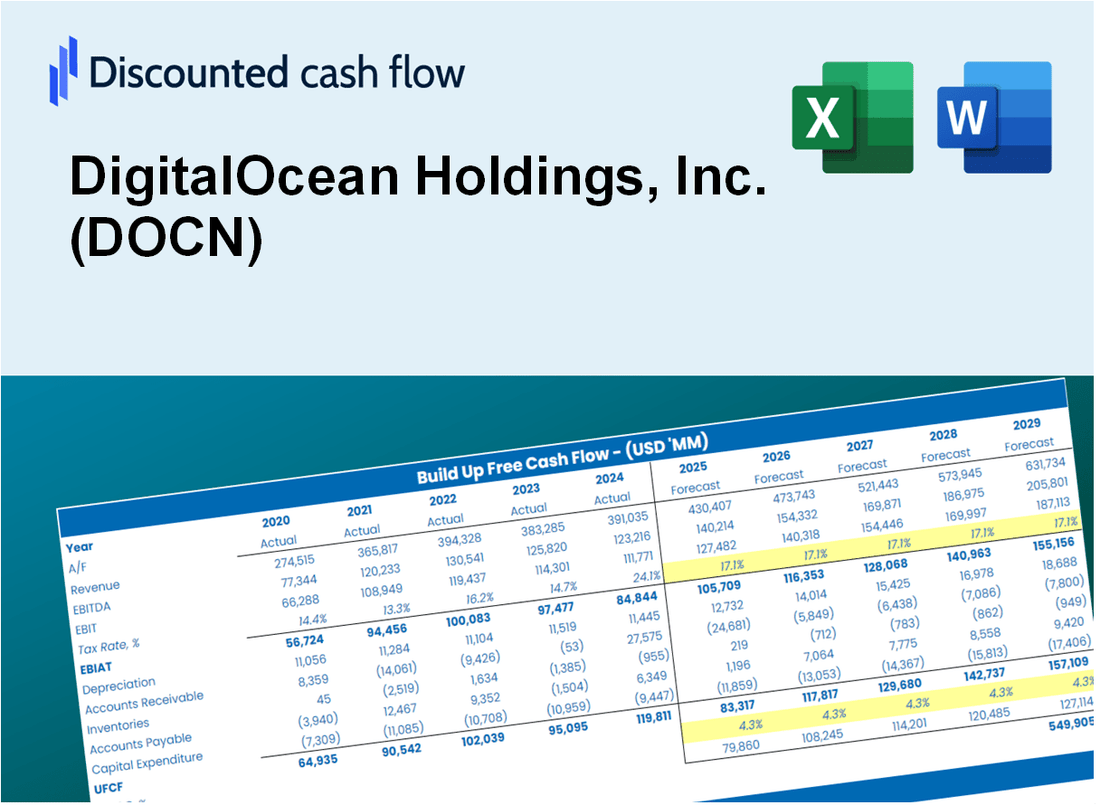
- Real-World Data: Historical data and forward-looking estimates (as displayed in the yellow cells).
- Forecast Flexibility: Adjust forecast assumptions such as revenue growth, EBITDA %, and WACC.
- Automatic Calculations: Quickly observe how your inputs affect DigitalOcean's valuation.
- Professional Tool: Designed for investors, CFOs, consultants, and financial analysts.
- User-Friendly Design: Organized for clarity and ease of use, complete with step-by-step instructions.
Key Features
- Accurate DigitalOcean Financials: Gain access to reliable pre-loaded historical data and future forecasts.
- Adjustable Forecast Parameters: Modify highlighted cells for key metrics like WACC, growth rates, and profit margins.
- Real-Time Calculations: Automatic updates for DCF, Net Present Value (NPV), and cash flow assessments.
- Interactive Dashboard: User-friendly charts and summaries to effectively visualize your valuation outcomes.
- Suitable for All Levels: A straightforward, intuitive design tailored for investors, CFOs, and consultants alike.
How It Works
- 1. Access the Template: Download and open the Excel file containing DigitalOcean's preloaded data.
- 2. Modify Assumptions: Adjust key parameters such as growth rates, WACC, and capital expenditures.
- 3. See Results Immediately: The DCF model automatically calculates intrinsic value and NPV.
- 4. Explore Scenarios: Evaluate various forecasts to assess different valuation results.
- 5. Present with Assurance: Share professional valuation insights to bolster your decision-making.
Why Choose This Calculator for DigitalOcean Holdings, Inc. (DOCN)?
- All-in-One Solution: Combines DCF, WACC, and financial ratio assessments tailored for DOCN.
- Flexible Inputs: Modify the highlighted cells to explore different financial scenarios.
- In-Depth Analysis: Automatically computes DigitalOcean’s intrinsic value and Net Present Value.
- Preloaded Information: Access historical and projected data for precise analysis.
- High-Quality Standards: Perfect for financial analysts, investors, and business advisors focusing on DOCN.
Who Should Use This Product?
- Professional Investors: Develop comprehensive and trustworthy valuation models for analyzing DigitalOcean (DOCN) investments.
- Corporate Finance Teams: Evaluate valuation scenarios to inform strategic decisions within the organization.
- Consultants and Advisors: Offer clients precise valuation insights related to DigitalOcean (DOCN) stock.
- Students and Educators: Utilize real-world data to enhance financial modeling skills in academic settings.
- Tech Enthusiasts: Gain insights into the market valuation of cloud service providers like DigitalOcean (DOCN).
What the Template Contains
- Comprehensive DCF Model: Editable template featuring in-depth valuation calculations.
- Real-World Data: DigitalOcean's historical and projected financials preloaded for thorough analysis.
- Customizable Parameters: Modify WACC, growth rates, and tax assumptions to explore various scenarios.
- Financial Statements: Complete annual and quarterly breakdowns for enhanced insights.
- Key Ratios: Integrated analysis for profitability, efficiency, and leverage metrics.
- Dashboard with Visual Outputs: Charts and tables designed for clear, actionable results.
Disclaimer
All information, articles, and product details provided on this website are for general informational and educational purposes only. We do not claim any ownership over, nor do we intend to infringe upon, any trademarks, copyrights, logos, brand names, or other intellectual property mentioned or depicted on this site. Such intellectual property remains the property of its respective owners, and any references here are made solely for identification or informational purposes, without implying any affiliation, endorsement, or partnership.
We make no representations or warranties, express or implied, regarding the accuracy, completeness, or suitability of any content or products presented. Nothing on this website should be construed as legal, tax, investment, financial, medical, or other professional advice. In addition, no part of this site—including articles or product references—constitutes a solicitation, recommendation, endorsement, advertisement, or offer to buy or sell any securities, franchises, or other financial instruments, particularly in jurisdictions where such activity would be unlawful.
All content is of a general nature and may not address the specific circumstances of any individual or entity. It is not a substitute for professional advice or services. Any actions you take based on the information provided here are strictly at your own risk. You accept full responsibility for any decisions or outcomes arising from your use of this website and agree to release us from any liability in connection with your use of, or reliance upon, the content or products found herein.