
|
DCF -Bewertung von Draganfly Inc. (DPRO) |
Fully Editable: Tailor To Your Needs In Excel Or Sheets
Professional Design: Trusted, Industry-Standard Templates
Investor-Approved Valuation Models
MAC/PC Compatible, Fully Unlocked
No Expertise Is Needed; Easy To Follow
Draganfly Inc. (DPRO) Bundle
Bewerten Sie die finanziellen Aussichten von Draganfly Inc. wie ein Experte! Dieser DCF-Taschenrechner (DPRO) bietet vorgefüllte Finanzdaten und vollständige Flexibilität, um das Umsatzwachstum, WACC, Margen und andere wichtige Annahmen zu ändern, um sich an Ihren Prognosen auszurichten.
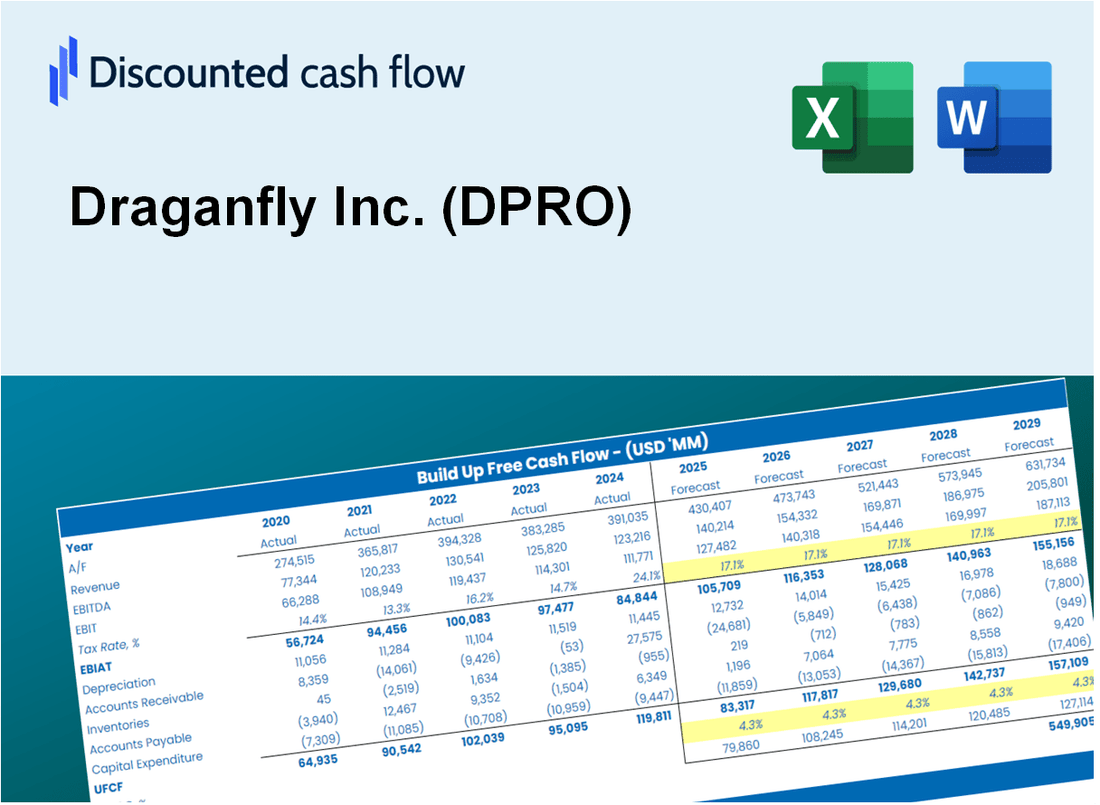
Discounted Cash Flow (DCF) - (USD MM)
| Year | AY1 2020 |
AY2 2021 |
AY3 2022 |
AY4 2023 |
AY5 2024 |
FY1 2025 |
FY2 2026 |
FY3 2027 |
FY4 2028 |
FY5 2029 |
|---|---|---|---|---|---|---|---|---|---|---|
| Revenue | 3.1 | 5.1 | 5.5 | 4.7 | 4.7 | 5.4 | 6.1 | 7.0 | 7.9 | 9.0 |
| Revenue Growth, % | 0 | 61.66 | 7.81 | -13.81 | 0.09478489 | 13.94 | 13.94 | 13.94 | 13.94 | 13.94 |
| EBITDA | -5.6 | -13.6 | -19.3 | -15.8 | -10.0 | -5.4 | -6.1 | -7.0 | -7.9 | -9.0 |
| EBITDA, % | -180.37 | -268.89 | -353.47 | -336.61 | -211.91 | -100 | -100 | -100 | -100 | -100 |
| Depreciation | .1 | .2 | .6 | .4 | .1 | .3 | .4 | .4 | .5 | .5 |
| Depreciation, % | 3.5 | 4.41 | 10.16 | 8.34 | 3.18 | 5.92 | 5.92 | 5.92 | 5.92 | 5.92 |
| EBIT | -5.8 | -13.8 | -19.8 | -16.2 | -10.1 | -5.4 | -6.1 | -7.0 | -7.9 | -9.0 |
| EBIT, % | -183.87 | -273.3 | -363.63 | -344.95 | -215.09 | -100 | -100 | -100 | -100 | -100 |
| Total Cash | 1.4 | 16.5 | 5.7 | 2.2 | 4.5 | 4.2 | 4.7 | 5.4 | 6.2 | 7.0 |
| Total Cash, percent | .0 | .0 | .0 | .0 | .0 | .0 | .0 | .0 | .0 | .0 |
| Account Receivables | .6 | 1.1 | 1.6 | .5 | .4 | 1.0 | 1.1 | 1.2 | 1.4 | 1.6 |
| Account Receivables, % | 18.58 | 22.64 | 29.69 | 9.91 | 8.74 | 17.91 | 17.91 | 17.91 | 17.91 | 17.91 |
| Inventories | .9 | 2.4 | .8 | 1.1 | 1.1 | 1.5 | 1.7 | 1.9 | 2.2 | 2.5 |
| Inventories, % | 28.27 | 48.07 | 13.88 | 24.36 | 23.35 | 27.59 | 27.59 | 27.59 | 27.59 | 27.59 |
| Accounts Payable | .6 | .3 | .5 | .9 | .4 | .7 | .8 | .9 | 1.0 | 1.1 |
| Accounts Payable, % | 18.65 | 5.14 | 9.88 | 19.22 | 9.3 | 12.44 | 12.44 | 12.44 | 12.44 | 12.44 |
| Capital Expenditure | .0 | -.2 | -.1 | -.4 | -.1 | -.2 | -.2 | -.2 | -.2 | -.3 |
| Capital Expenditure, % | -0.54745 | -3.01 | -1.11 | -7.48 | -2.55 | -2.94 | -2.94 | -2.94 | -2.94 | -2.94 |
| Tax Rate, % | 0 | 0 | 0 | 0 | 0 | 0 | 0 | 0 | 0 | 0 |
| EBITAT | -6.7 | -11.2 | -20.9 | -16.2 | -10.1 | -5.2 | -5.9 | -6.7 | -7.6 | -8.7 |
| Depreciation | ||||||||||
| Changes in Account Receivables | ||||||||||
| Changes in Inventories | ||||||||||
| Changes in Accounts Payable | ||||||||||
| Capital Expenditure | ||||||||||
| UFCF | -7.5 | -13.6 | -18.9 | -15.0 | -10.5 | -5.7 | -5.9 | -6.8 | -7.7 | -8.8 |
| WACC, % | 16.75 | 16.75 | 16.75 | 16.75 | 16.75 | 16.75 | 16.75 | 16.75 | 16.75 | 16.75 |
| PV UFCF | ||||||||||
| SUM PV UFCF | -21.7 | |||||||||
| Long Term Growth Rate, % | 2.00 | |||||||||
| Free cash flow (T + 1) | -9 | |||||||||
| Terminal Value | -61 | |||||||||
| Present Terminal Value | -28 | |||||||||
| Enterprise Value | -50 | |||||||||
| Net Debt | -4 | |||||||||
| Equity Value | -46 | |||||||||
| Diluted Shares Outstanding, MM | 3 | |||||||||
| Equity Value Per Share | -14.43 |
What You Will Get
- Comprehensive DPRO Financials: Access historical and projected data for precise valuation.
- Customizable Inputs: Adjust WACC, tax rates, revenue growth, and capital expenditures as needed.
- Dynamic Calculations: Intrinsic value and NPV are computed automatically.
- Scenario Analysis: Evaluate various scenarios to assess Draganfly's future performance.
- User-Friendly Interface: Designed for experts while remaining approachable for newcomers.
Key Features
- Customizable Financial Metrics: Adjust essential inputs such as revenue projections, profit margins, and investment costs.
- Instant DCF Valuation: Quickly computes intrinsic value, net present value, and additional financial metrics.
- High Precision Results: Leverages Draganfly Inc.'s real-world financial data for accurate valuation assessments.
- Effortless Scenario Analysis: Easily explore various assumptions and evaluate different financial outcomes.
- Efficiency Booster: Remove the hassle of constructing intricate valuation models from the ground up.
How It Works
- Step 1: Download the Excel file.
- Step 2: Review pre-entered Draganfly Inc. (DPRO) data (historical and projected).
- Step 3: Adjust key assumptions (yellow cells) based on your analysis.
- Step 4: View automatic recalculations for Draganfly Inc.'s intrinsic value.
- Step 5: Use the outputs for investment decisions or reporting.
Why Choose Draganfly Inc. (DPRO)?
- Innovative Technology: Cutting-edge solutions that lead the industry in drone applications.
- Proven Track Record: Established history of successful deployments and satisfied clients.
- Comprehensive Support: Dedicated customer service to assist you every step of the way.
- Scalable Solutions: Flexible products that grow with your business needs.
- Industry Recognition: A trusted name among professionals in the aerospace and technology sectors.
Who Should Use This Product?
- Individual Investors: Make informed decisions about buying or selling Draganfly Inc. (DPRO) stock.
- Financial Analysts: Streamline valuation processes with ready-to-use financial models for Draganfly Inc. (DPRO).
- Consultants: Deliver professional valuation insights on Draganfly Inc. (DPRO) to clients quickly and accurately.
- Business Owners: Understand how innovative companies like Draganfly Inc. (DPRO) are valued to guide your own strategy.
- Finance Students: Learn valuation techniques using real-world data and scenarios involving Draganfly Inc. (DPRO).
What the Template Contains
- Operating and Balance Sheet Data: Pre-filled Draganfly Inc. (DPRO) historical data and forecasts, including revenue, EBITDA, EBIT, and capital expenditures.
- WACC Calculation: A dedicated sheet for Weighted Average Cost of Capital (WACC), including parameters like Beta, risk-free rate, and share price.
- DCF Valuation (Unlevered and Levered): Editable Discounted Cash Flow models showing intrinsic value with detailed calculations.
- Financial Statements: Pre-loaded financial statements (annual and quarterly) to support analysis.
- Key Ratios: Includes profitability, leverage, and efficiency ratios for Draganfly Inc. (DPRO).
- Dashboard and Charts: Visual summary of valuation outputs and assumptions to analyze results easily.
Disclaimer
All information, articles, and product details provided on this website are for general informational and educational purposes only. We do not claim any ownership over, nor do we intend to infringe upon, any trademarks, copyrights, logos, brand names, or other intellectual property mentioned or depicted on this site. Such intellectual property remains the property of its respective owners, and any references here are made solely for identification or informational purposes, without implying any affiliation, endorsement, or partnership.
We make no representations or warranties, express or implied, regarding the accuracy, completeness, or suitability of any content or products presented. Nothing on this website should be construed as legal, tax, investment, financial, medical, or other professional advice. In addition, no part of this site—including articles or product references—constitutes a solicitation, recommendation, endorsement, advertisement, or offer to buy or sell any securities, franchises, or other financial instruments, particularly in jurisdictions where such activity would be unlawful.
All content is of a general nature and may not address the specific circumstances of any individual or entity. It is not a substitute for professional advice or services. Any actions you take based on the information provided here are strictly at your own risk. You accept full responsibility for any decisions or outcomes arising from your use of this website and agree to release us from any liability in connection with your use of, or reliance upon, the content or products found herein.