
|
DCF -Bewertung der angetriebenen Brands Holdings Inc. (DRVN) |
Fully Editable: Tailor To Your Needs In Excel Or Sheets
Professional Design: Trusted, Industry-Standard Templates
Investor-Approved Valuation Models
MAC/PC Compatible, Fully Unlocked
No Expertise Is Needed; Easy To Follow
Driven Brands Holdings Inc. (DRVN) Bundle
Verbessern Sie Ihre Anlagestrategien mit dem DCF -Taschenrechner des Driven Brands Holdings Inc. (DRVN)! Tauchen Sie in reale Finanzdaten ein, passen Sie die Wachstumsvorhersagen und -kosten an und beobachten Sie sofort, wie sich diese Veränderungen auf den inneren Wert von gesteuerten Marken Holdings Inc. (DRVN) auswirken.
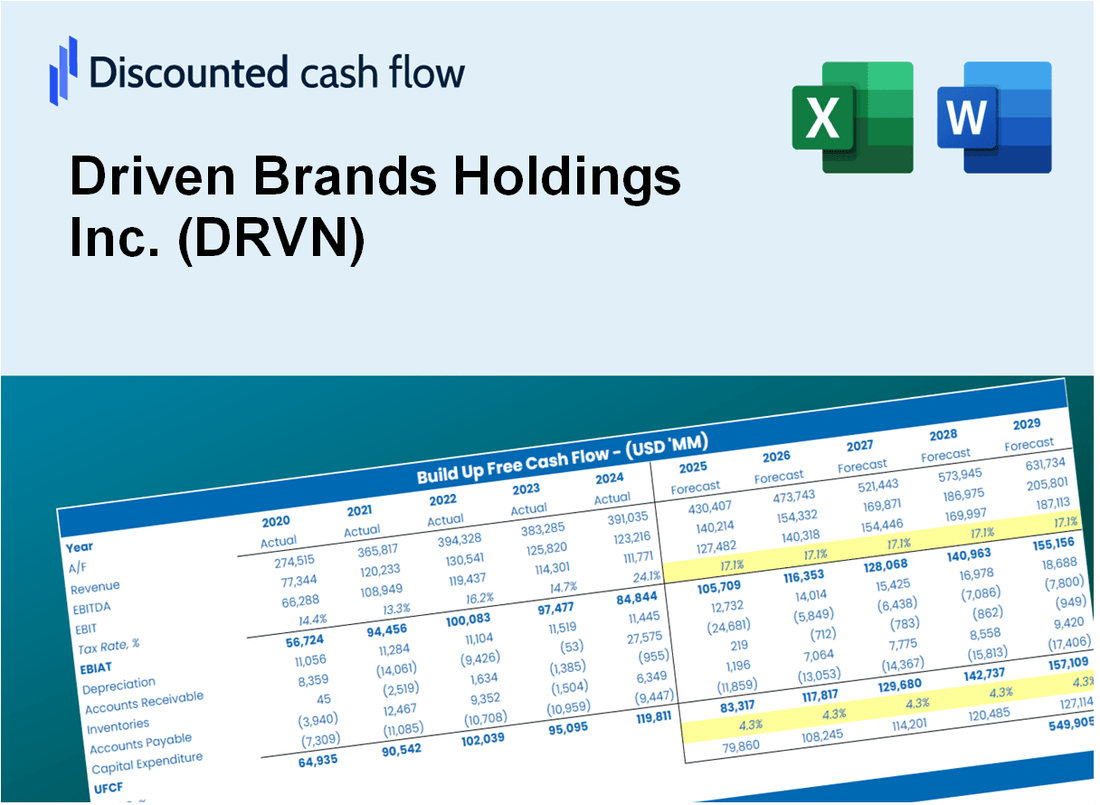
Discounted Cash Flow (DCF) - (USD MM)
| Year | AY1 2020 |
AY2 2021 |
AY3 2022 |
AY4 2023 |
AY5 2024 |
FY1 2025 |
FY2 2026 |
FY3 2027 |
FY4 2028 |
FY5 2029 |
|---|---|---|---|---|---|---|---|---|---|---|
| Revenue | 904.2 | 1,467.3 | 2,033.2 | 2,304.0 | 2,339.6 | 3,016.4 | 3,888.9 | 5,013.8 | 6,464.1 | 8,334.0 |
| Revenue Growth, % | 0 | 62.27 | 38.57 | 13.32 | 1.54 | 28.93 | 28.93 | 28.93 | 28.93 | 28.93 |
| EBITDA | 164.9 | 223.6 | 329.6 | -506.2 | 27.7 | 174.3 | 224.8 | 289.8 | 373.6 | 481.7 |
| EBITDA, % | 18.24 | 15.24 | 16.21 | -21.97 | 1.18 | 5.78 | 5.78 | 5.78 | 5.78 | 5.78 |
| Depreciation | 62.1 | 112.8 | 147.2 | 177.2 | 188.4 | 226.4 | 292.0 | 376.4 | 485.3 | 625.7 |
| Depreciation, % | 6.87 | 7.69 | 7.24 | 7.69 | 8.05 | 7.51 | 7.51 | 7.51 | 7.51 | 7.51 |
| EBIT | 102.8 | 110.8 | 182.4 | -683.5 | -160.7 | -52.1 | -67.2 | -86.6 | -111.7 | -144.0 |
| EBIT, % | 11.37 | 7.55 | 8.97 | -29.66 | -6.87 | -1.73 | -1.73 | -1.73 | -1.73 | -1.73 |
| Total Cash | 172.6 | 523.4 | 227.1 | 176.5 | 170.0 | 487.8 | 628.9 | 810.8 | 1,045.4 | 1,347.7 |
| Total Cash, percent | .0 | .0 | .0 | .0 | .0 | .0 | .0 | .0 | .0 | .0 |
| Account Receivables | 87.9 | 124.8 | 195.0 | 167.2 | 193.3 | 261.4 | 337.0 | 434.5 | 560.2 | 722.2 |
| Account Receivables, % | 9.72 | 8.5 | 9.59 | 7.26 | 8.26 | 8.67 | 8.67 | 8.67 | 8.67 | 8.67 |
| Inventories | 43.0 | 47.0 | 72.0 | 83.2 | 67.5 | 108.6 | 140.0 | 180.5 | 232.7 | 300.1 |
| Inventories, % | 4.76 | 3.2 | 3.54 | 3.61 | 2.89 | 3.6 | 3.6 | 3.6 | 3.6 | 3.6 |
| Accounts Payable | 67.8 | 83.0 | 60.6 | 67.5 | 95.3 | 139.6 | 180.0 | 232.0 | 299.2 | 385.7 |
| Accounts Payable, % | 7.5 | 5.66 | 2.98 | 2.93 | 4.07 | 4.63 | 4.63 | 4.63 | 4.63 | 4.63 |
| Capital Expenditure | -52.5 | -160.8 | -436.2 | -596.5 | -288.5 | -461.1 | -594.5 | -766.4 | -988.1 | -1,274.0 |
| Capital Expenditure, % | -5.8 | -10.96 | -21.45 | -25.89 | -12.33 | -15.29 | -15.29 | -15.29 | -15.29 | -15.29 |
| Tax Rate, % | 7.92 | 7.92 | 7.92 | 7.92 | 7.92 | 7.92 | 7.92 | 7.92 | 7.92 | 7.92 |
| EBITAT | -60.3 | 30.6 | 115.3 | -600.7 | -148.0 | -28.2 | -36.4 | -46.9 | -60.5 | -78.0 |
| Depreciation | ||||||||||
| Changes in Account Receivables | ||||||||||
| Changes in Inventories | ||||||||||
| Changes in Accounts Payable | ||||||||||
| Capital Expenditure | ||||||||||
| UFCF | -113.8 | -43.0 | -291.4 | -996.4 | -230.8 | -327.7 | -405.5 | -522.8 | -674.1 | -869.1 |
| WACC, % | 3.11 | 3.81 | 4.71 | 5.33 | 5.43 | 4.48 | 4.48 | 4.48 | 4.48 | 4.48 |
| PV UFCF | ||||||||||
| SUM PV UFCF | -2,407.4 | |||||||||
| Long Term Growth Rate, % | 3.50 | |||||||||
| Free cash flow (T + 1) | -900 | |||||||||
| Terminal Value | -91,927 | |||||||||
| Present Terminal Value | -73,842 | |||||||||
| Enterprise Value | -76,250 | |||||||||
| Net Debt | 3,827 | |||||||||
| Equity Value | -80,077 | |||||||||
| Diluted Shares Outstanding, MM | 160 | |||||||||
| Equity Value Per Share | -499.48 |
What You Will Receive
- Adjustable Forecast Inputs: Effortlessly modify key assumptions (growth %, margins, WACC) to explore various scenarios.
- Comprehensive Financial Data: Driven Brands’ financial metrics pre-loaded to facilitate your analysis.
- Automated DCF Calculations: The template computes Net Present Value (NPV) and intrinsic value seamlessly.
- Tailored and Professional Design: A refined Excel model that caters to your valuation requirements.
- Designed for Analysts and Investors: Perfect for evaluating projections, confirming strategies, and enhancing efficiency.
Key Features
- Customizable Financial Inputs: Adjust essential metrics such as revenue growth, EBITDA margin, and capital investments.
- Instant DCF Valuation: Quickly computes intrinsic value, NPV, and additional financial metrics.
- High-Precision Accuracy: Leverages Driven Brands Holdings Inc.'s (DRVN) actual financial data for credible valuation results.
- Effortless Scenario Analysis: Evaluate various assumptions and analyze outcomes with ease.
- Efficiency Booster: Streamlines the process by removing the need for intricate valuation models from the ground up.
How It Works
- Step 1: Download the Excel file.
- Step 2: Review pre-entered Driven Brands data (historical and projected).
- Step 3: Adjust key assumptions (yellow cells) based on your analysis.
- Step 4: View automatic recalculations for Driven Brands' intrinsic value.
- Step 5: Use the outputs for investment decisions or reporting.
Why Choose Driven Brands Holdings Inc. (DRVN)?
- Streamlined Operations: Benefit from an integrated platform that simplifies your automotive service needs.
- Enhanced Performance: Our proven business model drives efficiency and profitability across all locations.
- Customizable Solutions: Adapt our services to meet the unique demands of your market.
- User-Friendly Interface: Intuitive tools and resources make managing your business straightforward.
- Backed by Industry Leaders: Supported by a team of experts committed to excellence and innovation.
Who Should Use This Product?
- Finance Students: Explore valuation methodologies and apply them using real-time data for Driven Brands Holdings Inc. (DRVN).
- Academics: Integrate advanced financial models into your teaching or research focused on Driven Brands Holdings Inc. (DRVN).
- Investors: Validate your investment hypotheses and evaluate valuation scenarios for Driven Brands Holdings Inc. (DRVN).
- Analysts: Enhance your analysis efficiency with a customizable DCF model tailored for Driven Brands Holdings Inc. (DRVN).
- Small Business Owners: Learn how large public companies like Driven Brands Holdings Inc. (DRVN) are valued and analyzed in the market.
What the Template Contains
- Preloaded DRVN Data: Historical and projected financial data, including revenue, EBIT, and capital expenditures.
- DCF and WACC Models: Professional-grade sheets for calculating intrinsic value and Weighted Average Cost of Capital.
- Editable Inputs: Yellow-highlighted cells for adjusting revenue growth, tax rates, and discount rates.
- Financial Statements: Comprehensive annual and quarterly financials for deeper analysis.
- Key Ratios: Profitability, leverage, and efficiency ratios to evaluate performance.
- Dashboard and Charts: Visual summaries of valuation outcomes and assumptions.
Disclaimer
All information, articles, and product details provided on this website are for general informational and educational purposes only. We do not claim any ownership over, nor do we intend to infringe upon, any trademarks, copyrights, logos, brand names, or other intellectual property mentioned or depicted on this site. Such intellectual property remains the property of its respective owners, and any references here are made solely for identification or informational purposes, without implying any affiliation, endorsement, or partnership.
We make no representations or warranties, express or implied, regarding the accuracy, completeness, or suitability of any content or products presented. Nothing on this website should be construed as legal, tax, investment, financial, medical, or other professional advice. In addition, no part of this site—including articles or product references—constitutes a solicitation, recommendation, endorsement, advertisement, or offer to buy or sell any securities, franchises, or other financial instruments, particularly in jurisdictions where such activity would be unlawful.
All content is of a general nature and may not address the specific circumstances of any individual or entity. It is not a substitute for professional advice or services. Any actions you take based on the information provided here are strictly at your own risk. You accept full responsibility for any decisions or outcomes arising from your use of this website and agree to release us from any liability in connection with your use of, or reliance upon, the content or products found herein.