
|
Dycom Industries, Inc. (DY) DCF -Bewertung |
Fully Editable: Tailor To Your Needs In Excel Or Sheets
Professional Design: Trusted, Industry-Standard Templates
Investor-Approved Valuation Models
MAC/PC Compatible, Fully Unlocked
No Expertise Is Needed; Easy To Follow
Dycom Industries, Inc. (DY) Bundle
Unabhängig davon, ob Sie ein Investor oder Analyst sind, ist dieser (DY) DCF -Taschenrechner Ihr wesentliches Werkzeug für eine genaue Bewertung. Mit Dycom Industries, Inc. Real Data, die Sie mit DYCOM Industries, Inc. vorinstallieren, können Sie Prognosen anpassen und die Auswirkungen sofort beobachten.
What You Will Receive
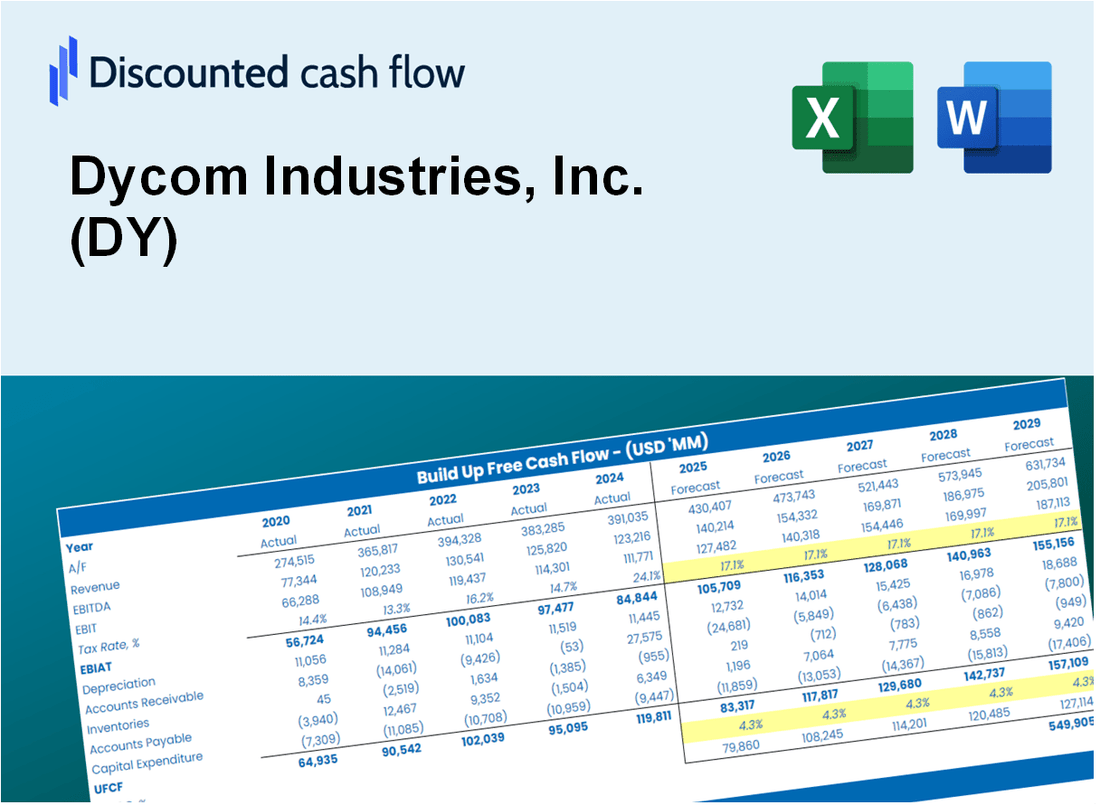
- Customizable Excel Template: A fully editable Excel-based DCF Calculator featuring pre-filled real Dycom Industries (DY) financials.
- Accurate Data: Access to historical data and forward-looking estimates (displayed in the highlighted cells).
- Flexible Forecasting: Adjust forecast assumptions such as revenue growth, EBITDA %, and WACC.
- Instant Calculations: Quickly observe how your inputs affect Dycom Industries' valuation.
- Professional Resource: Designed for investors, CFOs, consultants, and financial analysts.
- Intuitive Layout: Organized for clarity and user-friendliness, complete with step-by-step guidance.
Key Features
- Comprehensive DCF Calculator: Features detailed unlevered and levered DCF valuation models tailored for Dycom Industries, Inc. (DY).
- WACC Calculator: Pre-configured Weighted Average Cost of Capital sheet with adjustable inputs to fit Dycom's financials.
- Customizable Forecast Assumptions: Easily adjust growth rates, capital expenditures, and discount rates specific to Dycom Industries.
- Integrated Financial Ratios: Evaluate profitability, leverage, and efficiency ratios relevant to Dycom Industries, Inc. (DY).
- Visual Dashboard and Charts: Graphical representations summarize essential valuation metrics for straightforward analysis.
How It Works
- Step 1: Download the Excel file.
- Step 2: Review pre-entered Dycom Industries data (historical and projected).
- Step 3: Adjust key assumptions (yellow cells) based on your analysis.
- Step 4: View automatic recalculations for Dycom Industries' intrinsic value.
- Step 5: Use the outputs for investment decisions or reporting.
Why Choose This Calculator for Dycom Industries, Inc. (DY)?
- Accurate Data: Utilize real Dycom Industries financials for trustworthy valuation outcomes.
- Customizable: Tailor essential parameters such as growth rates, WACC, and tax rates to align with your forecasts.
- Time-Saving: Built-in calculations save you from starting from the ground up.
- Professional-Grade Tool: Crafted for investors, analysts, and consultants in the industry.
- User-Friendly: Easy-to-navigate layout and clear instructions make it accessible for all users.
Who Should Use This Product?
- Investors: Accurately estimate Dycom Industries’ fair value before making investment decisions.
- CFOs: Leverage a professional-grade DCF model for financial reporting and analysis related to Dycom Industries (DY).
- Consultants: Quickly adapt the template for valuation reports for clients interested in Dycom Industries (DY).
- Entrepreneurs: Gain insights into financial modeling used by leading companies like Dycom Industries (DY).
- Educators: Use it as a teaching tool to demonstrate valuation methodologies applicable to Dycom Industries (DY).
What the Template Contains for Dycom Industries, Inc. (DY)
- Preloaded DY Data: Historical and projected financial data, including revenue, EBIT, and capital expenditures.
- DCF and WACC Models: Professional-grade sheets for calculating intrinsic value and Weighted Average Cost of Capital.
- Editable Inputs: Yellow-highlighted cells for adjusting revenue growth, tax rates, and discount rates.
- Financial Statements: Comprehensive annual and quarterly financials for deeper analysis.
- Key Ratios: Profitability, leverage, and efficiency ratios to evaluate performance.
- Dashboard and Charts: Visual summaries of valuation outcomes and assumptions.
Disclaimer
All information, articles, and product details provided on this website are for general informational and educational purposes only. We do not claim any ownership over, nor do we intend to infringe upon, any trademarks, copyrights, logos, brand names, or other intellectual property mentioned or depicted on this site. Such intellectual property remains the property of its respective owners, and any references here are made solely for identification or informational purposes, without implying any affiliation, endorsement, or partnership.
We make no representations or warranties, express or implied, regarding the accuracy, completeness, or suitability of any content or products presented. Nothing on this website should be construed as legal, tax, investment, financial, medical, or other professional advice. In addition, no part of this site—including articles or product references—constitutes a solicitation, recommendation, endorsement, advertisement, or offer to buy or sell any securities, franchises, or other financial instruments, particularly in jurisdictions where such activity would be unlawful.
All content is of a general nature and may not address the specific circumstances of any individual or entity. It is not a substitute for professional advice or services. Any actions you take based on the information provided here are strictly at your own risk. You accept full responsibility for any decisions or outcomes arising from your use of this website and agree to release us from any liability in connection with your use of, or reliance upon, the content or products found herein.