|
Dyadic International, Inc. (Dyai) DCF -Bewertung |
Fully Editable: Tailor To Your Needs In Excel Or Sheets
Professional Design: Trusted, Industry-Standard Templates
Investor-Approved Valuation Models
MAC/PC Compatible, Fully Unlocked
No Expertise Is Needed; Easy To Follow
Dyadic International, Inc. (DYAI) Bundle
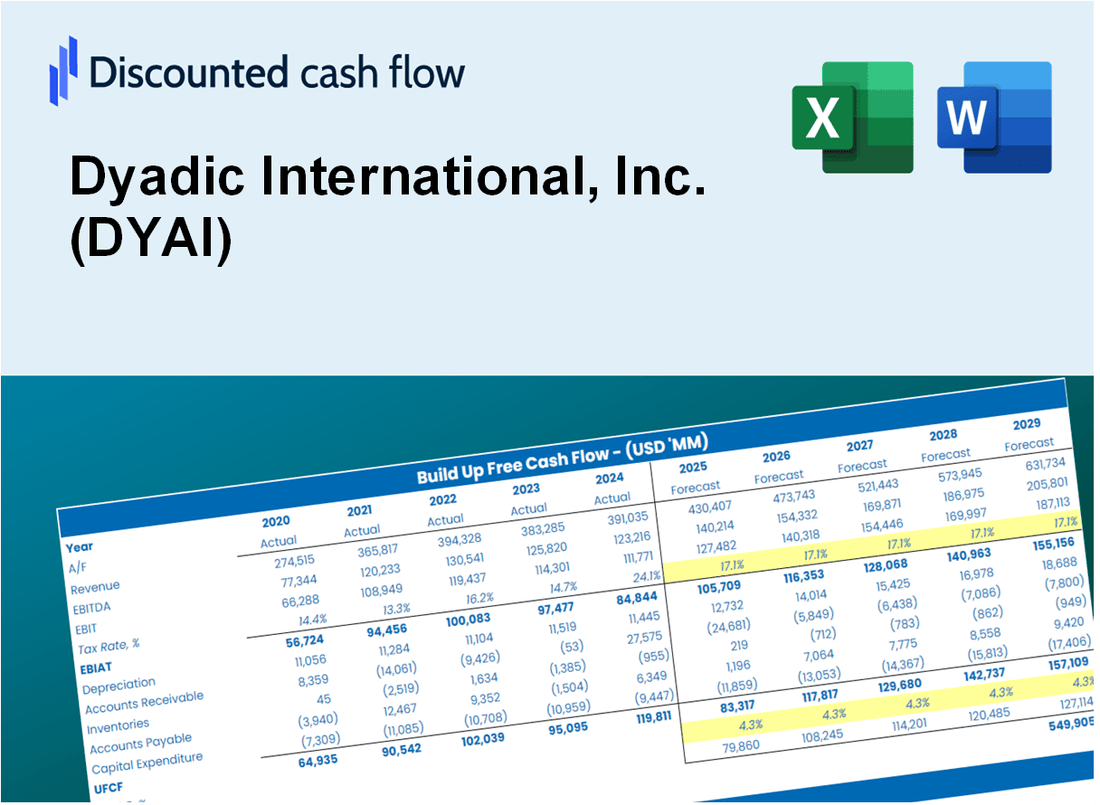
Vereinfachen Sie die Bewertung der dyadischen International, Inc. (DYAI) mit diesem anpassbaren DCF -Taschenrechner! Mit Real Dyadic International, Inc. (DYAI) Finanzdaten und einstellbaren Prognoseeingaben können Sie Szenarien testen und dyadische International, Inc. (DYAI) in Minuten aufdecken.
What You Will Receive
- Comprehensive Financial Model: Dyadic International, Inc.'s (DYAI) actual data facilitates accurate DCF valuation.
- Complete Forecast Flexibility: Modify revenue growth, profit margins, WACC, and other essential factors.
- Real-Time Calculations: Automatic updates provide immediate feedback as you adjust inputs.
- Professional-Grade Template: A polished Excel file crafted for high-quality valuation purposes.
- Adaptable and Reusable: Designed for versatility, enabling repeated application for in-depth forecasting.
Key Features
- Comprehensive Data: Dyadic International’s historical financial statements and pre-filled projections.
- Customizable Assumptions: Modify WACC, tax rates, revenue growth, and EBITDA margins as needed.
- Real-Time Insights: View Dyadic International’s intrinsic value recalculating instantly.
- Visual Performance Metrics: Interactive dashboard charts illustrate valuation results and essential metrics.
- Engineered for Precision: A robust tool designed for analysts, investors, and finance professionals.
How It Works
- 1. Access the Template: Download and open the Excel file featuring Dyadic International, Inc.'s (DYAI) preloaded data.
- 2. Adjust Assumptions: Modify key inputs such as growth rates, WACC, and capital expenditures to fit your analysis.
- 3. Instant Results: The DCF model automatically computes intrinsic value and NPV based on your inputs.
- 4. Explore Scenarios: Evaluate multiple forecasts to understand various valuation possibilities.
- 5. Present with Confidence: Share professional valuation insights to enhance your decision-making process.
Why Choose This Calculator for Dyadic International, Inc. (DYAI)?
- User-Friendly Interface: Tailored for both novices and seasoned users.
- Customizable Inputs: Adjust parameters to suit your specific analysis needs.
- Real-Time Feedback: Observe immediate fluctuations in Dyadic's valuation as you modify inputs.
- Pre-Configured Data: Comes preloaded with Dyadic's latest financial metrics for swift evaluations.
- Relied Upon by Experts: Favored by investors and analysts for making well-informed choices.
Who Should Use Dyadic International, Inc. (DYAI)?
- Investors: Make informed choices with a cutting-edge biotechnology investment tool.
- Biotech Analysts: Streamline your analysis with a comprehensive model tailored for the biotech sector.
- Consultants: Easily modify the framework for client discussions or strategy reports.
- Biotechnology Enthusiasts: Enhance your knowledge of biotech innovations through practical examples.
- Educators and Students: Utilize it as a hands-on resource in biotechnology and finance courses.
What the Template Contains
- Preloaded DYAI Data: Historical and projected financial data, including revenue, EBIT, and capital expenditures.
- DCF and WACC Models: Professional-grade sheets for calculating intrinsic value and Weighted Average Cost of Capital.
- Editable Inputs: Yellow-highlighted cells for adjusting revenue growth, tax rates, and discount rates.
- Financial Statements: Comprehensive annual and quarterly financials for deeper analysis.
- Key Ratios: Profitability, leverage, and efficiency ratios to evaluate performance.
- Dashboard and Charts: Visual summaries of valuation outcomes and assumptions.
Disclaimer
All information, articles, and product details provided on this website are for general informational and educational purposes only. We do not claim any ownership over, nor do we intend to infringe upon, any trademarks, copyrights, logos, brand names, or other intellectual property mentioned or depicted on this site. Such intellectual property remains the property of its respective owners, and any references here are made solely for identification or informational purposes, without implying any affiliation, endorsement, or partnership.
We make no representations or warranties, express or implied, regarding the accuracy, completeness, or suitability of any content or products presented. Nothing on this website should be construed as legal, tax, investment, financial, medical, or other professional advice. In addition, no part of this site—including articles or product references—constitutes a solicitation, recommendation, endorsement, advertisement, or offer to buy or sell any securities, franchises, or other financial instruments, particularly in jurisdictions where such activity would be unlawful.
All content is of a general nature and may not address the specific circumstances of any individual or entity. It is not a substitute for professional advice or services. Any actions you take based on the information provided here are strictly at your own risk. You accept full responsibility for any decisions or outcomes arising from your use of this website and agree to release us from any liability in connection with your use of, or reliance upon, the content or products found herein.