
|
E2E Networks Limited (E2E.NS) DCF -Bewertung |
Fully Editable: Tailor To Your Needs In Excel Or Sheets
Professional Design: Trusted, Industry-Standard Templates
Investor-Approved Valuation Models
MAC/PC Compatible, Fully Unlocked
No Expertise Is Needed; Easy To Follow
E2E Networks Limited (E2E.NS) Bundle
Verbessern Sie Ihre Investitionsauswahl mit dem DCF -Taschenrechner von E2E Networks Limited (E2ENs)! Gewinnen Sie Erkenntnisse aus realen Finanzdaten, passen Sie Wachstumsprojektionen und -kosten an und beobachten Sie sofort, wie sich diese Modifikationen auf den inneren Wert von E2E -Netzwerken beschränkten (E2ENs) auswirken.
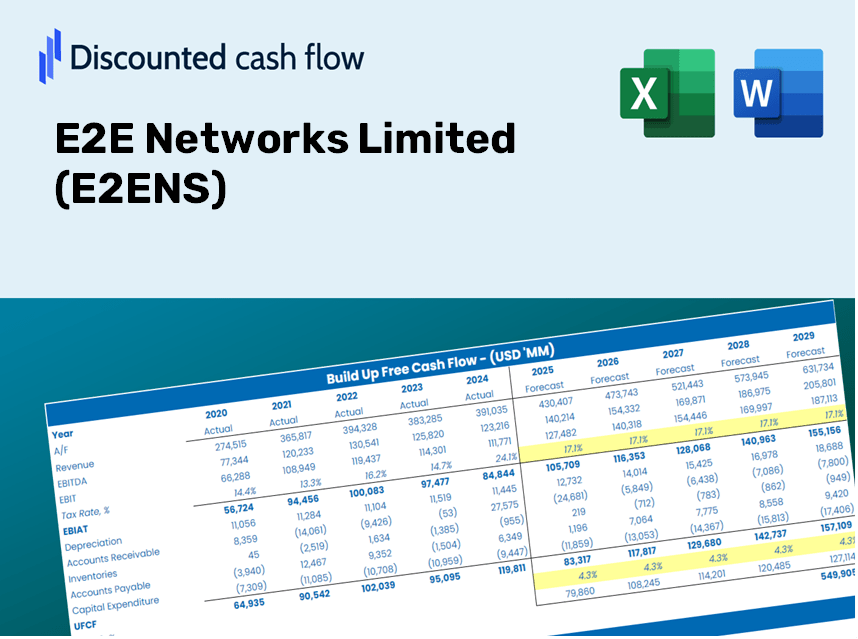
Discounted Cash Flow (DCF) - (USD MM)
| Year | AY1 2021 |
AY2 2022 |
AY3 2023 |
AY4 2024 |
AY5 2025 |
FY1 2026 |
FY2 2027 |
FY3 2028 |
FY4 2029 |
FY5 2030 |
|---|---|---|---|---|---|---|---|---|---|---|
| Revenue | 353.0 | 518.7 | 662.0 | 944.6 | 1,639.6 | 2,421.8 | 3,577.1 | 5,283.6 | 7,804.2 | 11,527.2 |
| Revenue Growth, % | 0 | 46.94 | 27.62 | 42.69 | 73.57 | 47.71 | 47.71 | 47.71 | 47.71 | 47.71 |
| EBITDA | 113.0 | 233.0 | 338.2 | 495.7 | 1,360.9 | 1,276.2 | 1,885.0 | 2,784.2 | 4,112.5 | 6,074.4 |
| EBITDA, % | 32 | 44.91 | 51.09 | 52.48 | 83 | 52.7 | 52.7 | 52.7 | 52.7 | 52.7 |
| Depreciation | 123.6 | 178.3 | 201.1 | 157.5 | 600.8 | 741.4 | 1,095.0 | 1,617.4 | 2,389.0 | 3,528.7 |
| Depreciation, % | 35.01 | 34.37 | 30.38 | 16.67 | 36.64 | 30.61 | 30.61 | 30.61 | 30.61 | 30.61 |
| EBIT | -10.6 | 54.7 | 137.1 | 338.3 | 760.1 | 534.8 | 790.0 | 1,166.8 | 1,723.5 | 2,545.7 |
| EBIT, % | -3.01 | 10.55 | 20.71 | 35.81 | 46.36 | 22.08 | 22.08 | 22.08 | 22.08 | 22.08 |
| Total Cash | 51.9 | 68.0 | 217.7 | 90.1 | 13,569.4 | 824.5 | 1,217.9 | 1,798.9 | 2,657.1 | 3,924.6 |
| Total Cash, percent | .0 | .0 | .0 | .0 | .0 | .0 | .0 | .0 | .0 | .0 |
| Account Receivables | 15.9 | 20.2 | 38.2 | 58.6 | 97.5 | 127.5 | 188.3 | 278.1 | 410.8 | 606.8 |
| Account Receivables, % | 4.51 | 3.89 | 5.77 | 6.2 | 5.95 | 5.26 | 5.26 | 5.26 | 5.26 | 5.26 |
| Inventories | .0 | 1.1 | -32.2 | .0 | .0 | -22.5 | -33.2 | -49.1 | -72.5 | -107.1 |
| Inventories, % | 0 | 0.21398 | -4.86 | 0 | 0 | -0.92905 | -0.92905 | -0.92905 | -0.92905 | -0.92905 |
| Accounts Payable | 21.6 | 22.5 | 25.0 | 60.4 | 71.5 | 121.0 | 178.8 | 264.1 | 390.0 | 576.1 |
| Accounts Payable, % | 6.13 | 4.34 | 3.78 | 6.39 | 4.36 | 5 | 5 | 5 | 5 | 5 |
| Capital Expenditure | -247.9 | -214.1 | -189.4 | -1,455.3 | -1,259.3 | -1,535.1 | -2,267.4 | -3,349.1 | -4,946.7 | -7,306.6 |
| Capital Expenditure, % | -70.23 | -41.28 | -28.61 | -154.06 | -76.81 | -63.39 | -63.39 | -63.39 | -63.39 | -63.39 |
| Tax Rate, % | 24.36 | 24.36 | 24.36 | 24.36 | 24.36 | 24.36 | 24.36 | 24.36 | 24.36 | 24.36 |
| EBITAT | -10.6 | 66.8 | 102.7 | 244.8 | 574.9 | 452.3 | 668.1 | 986.9 | 1,457.6 | 2,153.0 |
| Depreciation | ||||||||||
| Changes in Account Receivables | ||||||||||
| Changes in Inventories | ||||||||||
| Changes in Accounts Payable | ||||||||||
| Capital Expenditure | ||||||||||
| UFCF | -129.3 | 26.4 | 132.2 | -1,070.2 | -111.5 | -299.3 | -496.6 | -733.5 | -1,083.4 | -1,600.2 |
| WACC, % | 6.02 | 6.02 | 5.97 | 5.96 | 5.97 | 5.99 | 5.99 | 5.99 | 5.99 | 5.99 |
| PV UFCF | ||||||||||
| SUM PV UFCF | -3,395.3 | |||||||||
| Long Term Growth Rate, % | 2.00 | |||||||||
| Free cash flow (T + 1) | -1,632 | |||||||||
| Terminal Value | -40,923 | |||||||||
| Present Terminal Value | -30,597 | |||||||||
| Enterprise Value | -33,992 | |||||||||
| Net Debt | -12,840 | |||||||||
| Equity Value | -21,153 | |||||||||
| Diluted Shares Outstanding, MM | 16 | |||||||||
| Equity Value Per Share | -1,282.66 |
What You Will Receive
- Pre-Filled Financial Model: E2E Networks Limited's actual data allows for accurate DCF valuation.
- Comprehensive Forecast Control: Modify revenue growth, profit margins, WACC, and other essential factors as needed.
- Real-Time Calculations: Automatic updates provide instant results as you make adjustments.
- Investor-Ready Template: A polished Excel file crafted for high-quality valuation presentations.
- Flexible and Reusable: Designed for adaptability, making it suitable for multiple detailed forecasts.
Key Features
- Customizable Forecast Inputs: Tailor essential metrics such as revenue growth, EBITDA percentage, and capital expenditure.
- Instant DCF Valuation: Quickly determines intrinsic value, NPV, and additional financial metrics.
- Industry-Leading Precision: Leverages E2E Networks Limited's real financial data for accurate valuation results.
- Simplified Scenario Analysis: Effortlessly explore varying assumptions and assess their impacts.
- Efficiency Booster: Say goodbye to the hassle of constructing intricate valuation models from the ground up.
How It Functions
- Step 1: Download the pre-configured Excel template featuring E2E Networks Limited (E2ENS) data.
- Step 2: Review the filled-in sheets and grasp the essential metrics.
- Step 3: Modify forecasts and assumptions in the editable yellow cells (WACC, growth, margins).
- Step 4: Immediately see the updated results, including E2E Networks Limited’s intrinsic value.
- Step 5: Use the results to make well-informed investment choices or to create reports.
Why Opt for the E2ENS Calculator?
- Time-Saving: Skip the hassle of building a DCF model from the ground up – it’s ready for immediate use.
- Enhanced Accuracy: Dependable financial data and formulas minimize valuation errors.
- Completely Customizable: Adjust the model to align with your specific assumptions and forecasts.
- Simple to Understand: Intuitive charts and outputs facilitate easy interpretation of results.
- Preferred by Professionals: Crafted for experts who prioritize precision and user-friendliness.
Who Can Benefit from This Product?
- Professional Investors: Develop comprehensive and trustworthy valuation models for analyzing portfolios involving E2E Networks Limited (E2ENS).
- Corporate Finance Teams: Evaluate valuation scenarios to inform and shape internal strategic decisions concerning E2E Networks Limited (E2ENS).
- Consultants and Advisors: Deliver precise valuation insights to clients focused on E2E Networks Limited (E2ENS) stock.
- Students and Educators: Utilize authentic data to enhance learning and practice in financial modeling related to E2E Networks Limited (E2ENS).
- Tech Enthusiasts: Gain insights into how tech firms like E2E Networks Limited (E2ENS) are assessed in the marketplace.
Contents of the Template
- Pre-Filled Data: Features E2E Networks Limited’s historical financials and projections.
- Discounted Cash Flow Model: An editable DCF valuation model that performs automatic calculations.
- Weighted Average Cost of Capital (WACC): A specialized sheet for computing WACC based on user-defined inputs.
- Key Financial Ratios: Assess E2E Networks Limited’s profitability, efficiency, and leverage metrics.
- Customizable Inputs: Easily modify revenue growth assumptions, profit margins, and tax rates.
- Clear Dashboard: Visualizations and tables that summarize essential valuation outcomes.
Disclaimer
All information, articles, and product details provided on this website are for general informational and educational purposes only. We do not claim any ownership over, nor do we intend to infringe upon, any trademarks, copyrights, logos, brand names, or other intellectual property mentioned or depicted on this site. Such intellectual property remains the property of its respective owners, and any references here are made solely for identification or informational purposes, without implying any affiliation, endorsement, or partnership.
We make no representations or warranties, express or implied, regarding the accuracy, completeness, or suitability of any content or products presented. Nothing on this website should be construed as legal, tax, investment, financial, medical, or other professional advice. In addition, no part of this site—including articles or product references—constitutes a solicitation, recommendation, endorsement, advertisement, or offer to buy or sell any securities, franchises, or other financial instruments, particularly in jurisdictions where such activity would be unlawful.
All content is of a general nature and may not address the specific circumstances of any individual or entity. It is not a substitute for professional advice or services. Any actions you take based on the information provided here are strictly at your own risk. You accept full responsibility for any decisions or outcomes arising from your use of this website and agree to release us from any liability in connection with your use of, or reliance upon, the content or products found herein.