
|
Ebet, Inc. (EBET) DCF -Bewertung |
Fully Editable: Tailor To Your Needs In Excel Or Sheets
Professional Design: Trusted, Industry-Standard Templates
Investor-Approved Valuation Models
MAC/PC Compatible, Fully Unlocked
No Expertise Is Needed; Easy To Follow
EBET, Inc. (EBET) Bundle
Gewinnen Sie mit unserem ausgefeilten DCF -Taschenrechner eine Meisterschaft über Ihre Ebet, Inc. (EBET) -Schabendanalyse! Diese Excel -Vorlage mit realen Ebet -Daten ermöglicht es Ihnen, Prognosen und Annahmen anzupassen, um den inneren Wert von Ebet, Inc. (EBET) genau zu bestimmen.
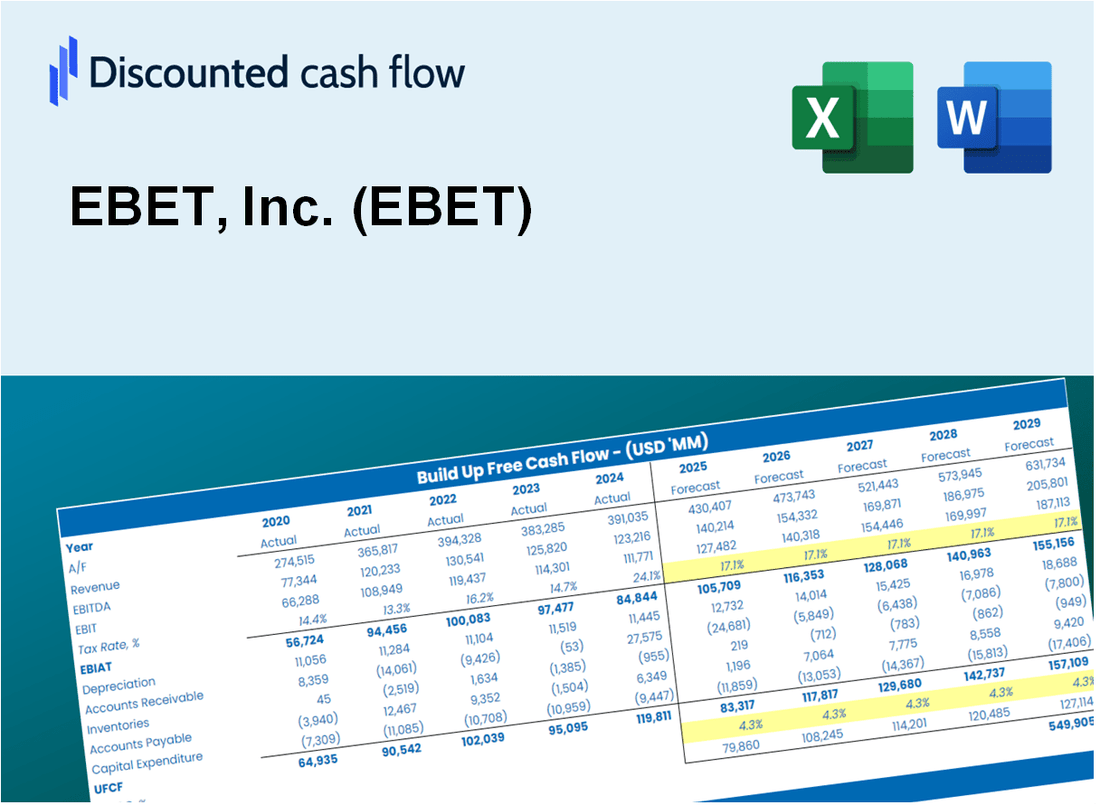
Discounted Cash Flow (DCF) - (USD MM)
| Year | AY1 2019 |
AY2 2020 |
AY3 2021 |
AY4 2022 |
AY5 2023 |
FY1 2024 |
FY2 2025 |
FY3 2026 |
FY4 2027 |
FY5 2028 |
|---|---|---|---|---|---|---|---|---|---|---|
| Revenue | .1 | .2 | .2 | 58.6 | 39.2 | 48.0 | 58.8 | 72.0 | 88.2 | 108.0 |
| Revenue Growth, % | 0 | 38.87 | -15.82 | 35454.69 | -33.14 | 22.48 | 22.48 | 22.48 | 22.48 | 22.48 |
| EBITDA | .0 | -.4 | -13.1 | -25.0 | -60.0 | -31.2 | -38.3 | -46.9 | -57.4 | -70.3 |
| EBITDA, % | 17.1 | -216 | -7928.92 | -42.63 | -153.19 | -65.11 | -65.11 | -65.11 | -65.11 | -65.11 |
| Depreciation | .2 | .0 | .4 | 6.6 | 7.1 | 19.7 | 24.2 | 29.6 | 36.3 | 44.4 |
| Depreciation, % | 121.9 | -23.57 | 259.83 | 11.18 | 18.16 | 41.15 | 41.15 | 41.15 | 41.15 | 41.15 |
| EBIT | -.1 | -.4 | -13.5 | -31.5 | -67.1 | -43.6 | -53.3 | -65.3 | -80.0 | -98.0 |
| EBIT, % | -104.81 | -192.42 | -8188.75 | -53.81 | -171.35 | -90.76 | -90.76 | -90.76 | -90.76 | -90.76 |
| Total Cash | .1 | .0 | 9.1 | 5.5 | .3 | 15.2 | 18.6 | 22.8 | 27.9 | 34.2 |
| Total Cash, percent | .0 | .0 | .0 | .0 | .0 | .0 | .0 | .0 | .0 | .0 |
| Account Receivables | .0 | .0 | .0 | 1.6 | .6 | 5.2 | 6.3 | 7.8 | 9.5 | 11.6 |
| Account Receivables, % | 19.03 | 17.28 | 13.13 | 2.81 | 1.64 | 10.78 | 10.78 | 10.78 | 10.78 | 10.78 |
| Inventories | .0 | .0 | .0 | .0 | .0 | .0 | .0 | .0 | .0 | .0 |
| Inventories, % | 0 | 0 | 0 | 0 | 0 | 0 | 0 | 0 | 0 | 0 |
| Accounts Payable | .0 | .2 | 1.7 | 13.4 | 22.8 | 27.8 | 34.1 | 41.7 | 51.1 | 62.6 |
| Accounts Payable, % | 8.89 | 106.57 | 1044.31 | 22.84 | 58.13 | 57.97 | 57.97 | 57.97 | 57.97 | 57.97 |
| Capital Expenditure | .0 | .0 | -.2 | -1.2 | .0 | -9.4 | -11.5 | -14.1 | -17.2 | -21.1 |
| Capital Expenditure, % | 0 | 0 | -95.7 | -2.05 | -0.02907281 | -19.55 | -19.55 | -19.55 | -19.55 | -19.55 |
| Tax Rate, % | 0 | 0 | 0 | 0 | 0 | 0 | 0 | 0 | 0 | 0 |
| EBITAT | -.1 | -.4 | -13.5 | -31.5 | -67.1 | -43.6 | -53.3 | -65.3 | -80.0 | -98.0 |
| Depreciation | ||||||||||
| Changes in Account Receivables | ||||||||||
| Changes in Inventories | ||||||||||
| Changes in Accounts Payable | ||||||||||
| Capital Expenditure | ||||||||||
| UFCF | .0 | -.2 | -11.7 | -16.1 | -49.6 | -32.7 | -35.6 | -43.5 | -53.3 | -65.3 |
| WACC, % | 42.98 | 42.98 | 42.98 | 42.98 | 42.98 | 42.98 | 42.98 | 42.98 | 42.98 | 42.98 |
| PV UFCF | ||||||||||
| SUM PV UFCF | -78.8 | |||||||||
| Long Term Growth Rate, % | 2.00 | |||||||||
| Free cash flow (T + 1) | -67 | |||||||||
| Terminal Value | -163 | |||||||||
| Present Terminal Value | -27 | |||||||||
| Enterprise Value | -106 | |||||||||
| Net Debt | 40 | |||||||||
| Equity Value | -146 | |||||||||
| Diluted Shares Outstanding, MM | 3 | |||||||||
| Equity Value Per Share | -52.57 |
What You Will Get
- Editable Forecast Inputs: Effortlessly modify assumptions (growth %, margins, WACC) to explore various scenarios.
- Real-World Data: EBET, Inc.’s (EBET) financial data pre-loaded to facilitate your analysis.
- Automatic DCF Outputs: The template computes Net Present Value (NPV) and intrinsic value automatically.
- Customizable and Professional: A sleek Excel model tailored to meet your valuation requirements.
- Built for Analysts and Investors: Perfect for evaluating projections, confirming strategies, and enhancing efficiency.
Key Features
- Accurate EBET Financial Data: Gain access to reliable pre-loaded historical figures and future estimates.
- Adjustable Forecast Parameters: Modify highlighted cells for WACC, growth rates, and profit margins.
- Real-Time Calculations: Automatic updates for DCF, Net Present Value (NPV), and cash flow assessments.
- User-Friendly Dashboard: Clear charts and summaries to easily visualize your valuation outcomes.
- Suitable for All Skill Levels: A straightforward, intuitive layout designed for investors, CFOs, and consultants.
How It Works
- Step 1: Download the prebuilt Excel template featuring EBET, Inc. (EBET) data.
- Step 2: Navigate through the pre-filled sheets to familiarize yourself with the key metrics.
- Step 3: Modify forecasts and assumptions in the editable yellow cells (WACC, growth, margins).
- Step 4: Instantly see recalculated results, including EBET, Inc. (EBET)'s intrinsic value.
- Step 5: Use the outputs to make informed investment decisions or generate comprehensive reports.
Why Choose EBET, Inc. (EBET)?
- Streamlined Process: Quickly access our tools without the hassle of starting from scratch.
- Enhanced Precision: Utilize our dependable financial data and formulas to minimize valuation errors.
- Completely Adaptable: Modify the model to align with your specific assumptions and forecasts.
- User-Friendly Interface: Intuitive charts and outputs simplify the analysis of results.
- Endorsed by Professionals: Crafted for industry experts who prioritize accuracy and functionality.
Who Should Use This Product?
- Individual Investors: Make informed decisions about buying or selling EBET, Inc. (EBET) stock.
- Financial Analysts: Streamline valuation processes with ready-to-use financial models for EBET, Inc. (EBET).
- Consultants: Deliver professional valuation insights on EBET, Inc. (EBET) to clients quickly and accurately.
- Business Owners: Understand how companies like EBET, Inc. (EBET) are valued to guide your own strategy.
- Finance Students: Learn valuation techniques using real-world data and scenarios related to EBET, Inc. (EBET).
What the Template Contains
- Operating and Balance Sheet Data: Pre-filled EBET, Inc. (EBET) historical data and forecasts, including revenue, EBITDA, EBIT, and capital expenditures.
- WACC Calculation: A dedicated sheet for Weighted Average Cost of Capital (WACC), including parameters like Beta, risk-free rate, and share price.
- DCF Valuation (Unlevered and Levered): Editable Discounted Cash Flow models showing intrinsic value with detailed calculations.
- Financial Statements: Pre-loaded financial statements (annual and quarterly) to support analysis.
- Key Ratios: Includes profitability, leverage, and efficiency ratios for EBET, Inc. (EBET).
- Dashboard and Charts: Visual summary of valuation outputs and assumptions to analyze results easily.
Disclaimer
All information, articles, and product details provided on this website are for general informational and educational purposes only. We do not claim any ownership over, nor do we intend to infringe upon, any trademarks, copyrights, logos, brand names, or other intellectual property mentioned or depicted on this site. Such intellectual property remains the property of its respective owners, and any references here are made solely for identification or informational purposes, without implying any affiliation, endorsement, or partnership.
We make no representations or warranties, express or implied, regarding the accuracy, completeness, or suitability of any content or products presented. Nothing on this website should be construed as legal, tax, investment, financial, medical, or other professional advice. In addition, no part of this site—including articles or product references—constitutes a solicitation, recommendation, endorsement, advertisement, or offer to buy or sell any securities, franchises, or other financial instruments, particularly in jurisdictions where such activity would be unlawful.
All content is of a general nature and may not address the specific circumstances of any individual or entity. It is not a substitute for professional advice or services. Any actions you take based on the information provided here are strictly at your own risk. You accept full responsibility for any decisions or outcomes arising from your use of this website and agree to release us from any liability in connection with your use of, or reliance upon, the content or products found herein.