
|
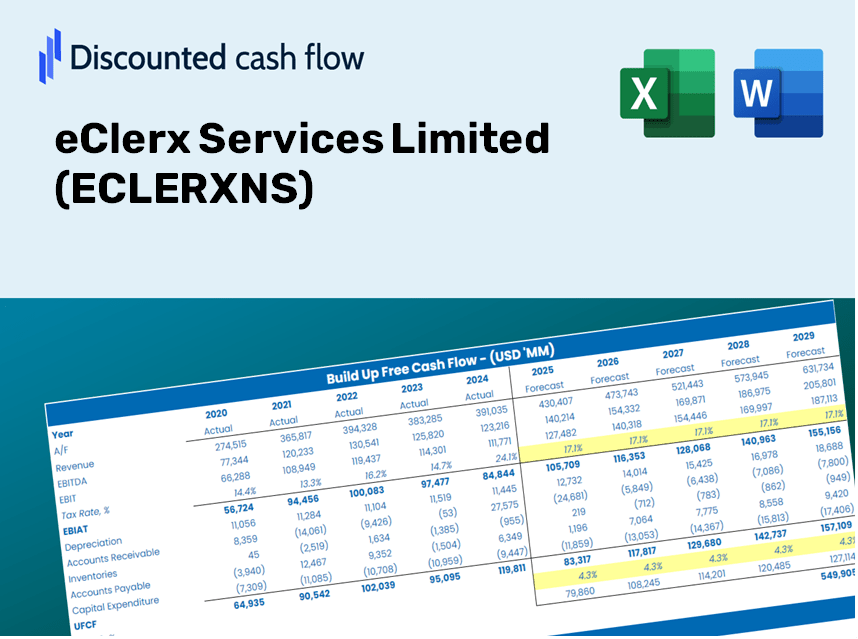
Eclerx Services Limited (Eclerx.NS) DCF -Bewertung |
Fully Editable: Tailor To Your Needs In Excel Or Sheets
Professional Design: Trusted, Industry-Standard Templates
Investor-Approved Valuation Models
MAC/PC Compatible, Fully Unlocked
No Expertise Is Needed; Easy To Follow
eClerx Services Limited (ECLERX.NS) Bundle
Möchten Sie den inneren Wert von Eclerx Services Limited bewerten? Unser (Eclerxns) DCF-Taschenrechner integriert reale Daten mit umfangreichen Anpassungsfunktionen, sodass Sie Ihre Prognosen verfeinern und Ihre Investitionsauswahl verbessern können.
What You Will Gain
- Pre-Filled Financial Model: eClerx Services Limited’s actual data allows for accurate DCF valuation.
- Comprehensive Forecast Control: Modify revenue growth, profit margins, WACC, and other essential parameters.
- Real-Time Calculations: Automatic updates provide instant feedback as you make adjustments.
- Investor-Ready Template: A polished Excel file crafted for high-quality valuation presentations.
- Customizable and Reusable: Designed for versatility, enabling repeated application for in-depth forecasts.
Key Features
- Comprehensive DCF Calculator: Features both unlevered and levered DCF valuation models tailored for eClerx Services Limited (ECLERXNS).
- WACC Calculator: Pre-configured Weighted Average Cost of Capital worksheet with options for personalized inputs.
- Customizable Forecast Assumptions: Adjust projections for growth rates, capital expenditures, and discount rates as needed.
- Integrated Financial Ratios: Evaluate profitability, leverage, and efficiency ratios specific to eClerx Services Limited (ECLERXNS).
- Interactive Dashboard and Charts: Visual representations that summarize essential valuation metrics for straightforward analysis.
How It Operates
- 1. Access the Template: Download and open the Excel file featuring eClerx Services Limited’s (ECLERXNS) preloaded data.
- 2. Adjust Key Inputs: Modify essential assumptions such as growth rates, WACC, and capital expenditures.
- 3. See Results in Real-Time: The DCF model automatically calculates the intrinsic value and NPV.
- 4. Explore Different Scenarios: Evaluate multiple forecasts to investigate various valuation results.
- 5. Present with Assurance: Deliver professional valuation insights to bolster your decision-making process.
Why Choose the eClerx Services Limited (ECLERXNS) Calculator?
- Precision: Leverages actual eClerx financial data for reliable results.
- Versatility: Allows users to easily adjust and experiment with various inputs.
- Efficiency: Avoid the complexities of constructing a financial model from the ground up.
- Expert-Level: Crafted with the expertise and detail expected from top CFOs.
- User-Centric: Intuitive design makes it accessible for users with varying levels of financial know-how.
Who Can Benefit from This Product?
- Institutional Investors: Develop comprehensive and accurate valuation models for portfolio evaluation.
- Corporate Finance Departments: Assess valuation scenarios to inform internal decision-making.
- Business Consultants and Advisors: Equip clients with precise valuation insights for eClerx Services Limited (ECLERXNS) stock.
- Academic Students and Instructors: Utilize real-world data to enhance financial modeling education and practice.
- Tech Industry Enthusiasts: Gain insights into the market valuation methods of firms like eClerx Services Limited (ECLERXNS).
Contents of the Template
- Pre-Filled DCF Model: eClerx Services Limited's (ECLERXNS) financial data preloaded for instant utilization.
- WACC Calculator: Comprehensive calculations for Weighted Average Cost of Capital.
- Financial Ratios: Assess eClerx's profitability, leverage, and operational efficiency.
- Editable Inputs: Modify assumptions such as growth rates, profit margins, and capital expenditures to suit your analysis.
- Financial Statements: Access annual and quarterly reports for in-depth review and insights.
- Interactive Dashboard: Effortlessly visualize essential valuation metrics and outcomes.
Disclaimer
All information, articles, and product details provided on this website are for general informational and educational purposes only. We do not claim any ownership over, nor do we intend to infringe upon, any trademarks, copyrights, logos, brand names, or other intellectual property mentioned or depicted on this site. Such intellectual property remains the property of its respective owners, and any references here are made solely for identification or informational purposes, without implying any affiliation, endorsement, or partnership.
We make no representations or warranties, express or implied, regarding the accuracy, completeness, or suitability of any content or products presented. Nothing on this website should be construed as legal, tax, investment, financial, medical, or other professional advice. In addition, no part of this site—including articles or product references—constitutes a solicitation, recommendation, endorsement, advertisement, or offer to buy or sell any securities, franchises, or other financial instruments, particularly in jurisdictions where such activity would be unlawful.
All content is of a general nature and may not address the specific circumstances of any individual or entity. It is not a substitute for professional advice or services. Any actions you take based on the information provided here are strictly at your own risk. You accept full responsibility for any decisions or outcomes arising from your use of this website and agree to release us from any liability in connection with your use of, or reliance upon, the content or products found herein.