
|
Eurodry Ltd. (Edry) DCF -Bewertung |
Fully Editable: Tailor To Your Needs In Excel Or Sheets
Professional Design: Trusted, Industry-Standard Templates
Investor-Approved Valuation Models
MAC/PC Compatible, Fully Unlocked
No Expertise Is Needed; Easy To Follow
EuroDry Ltd. (EDRY) Bundle
Entdecken Sie den wahren Wert von Eurodry Ltd. (Edry) mit unserem fortschrittlichen DCF -Taschenrechner! Passen Sie wesentliche Annahmen an, erkunden Sie verschiedene Szenarien und beurteilen Sie, wie sich Änderungen auf die Bewertung von Eurodry Ltd. (EDRY) auswirken - alles innerhalb einer bequemen Excel -Vorlage.
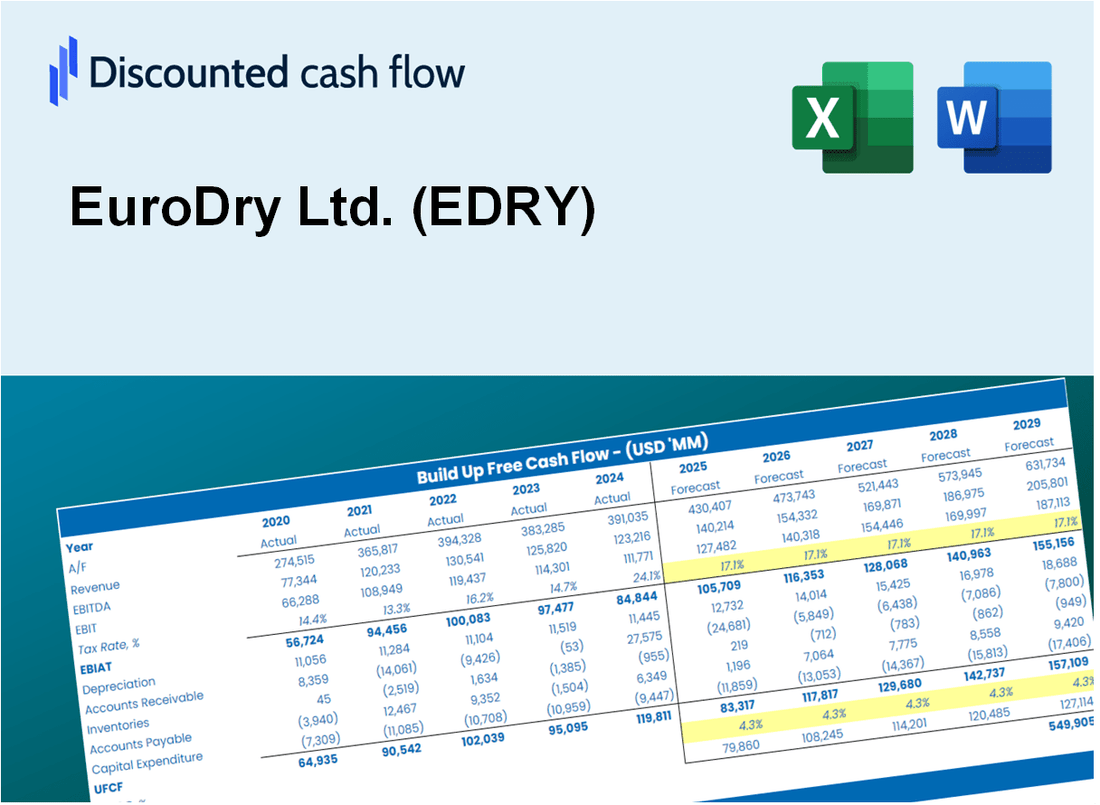
Discounted Cash Flow (DCF) - (USD MM)
| Year | AY1 2020 |
AY2 2021 |
AY3 2022 |
AY4 2023 |
AY5 2024 |
FY1 2025 |
FY2 2026 |
FY3 2027 |
FY4 2028 |
FY5 2029 |
|---|---|---|---|---|---|---|---|---|---|---|
| Revenue | 22.3 | 64.4 | 70.2 | 47.6 | 61.1 | 72.7 | 86.6 | 103.0 | 122.6 | 146.0 |
| Revenue Growth, % | 0 | 189.12 | 8.91 | -32.19 | 28.35 | 19.03 | 19.03 | 19.03 | 19.03 | 19.03 |
| EBITDA | 3.2 | 41.4 | 48.4 | 14.2 | 13.3 | 28.9 | 34.4 | 41.0 | 48.8 | 58.1 |
| EBITDA, % | 14.14 | 64.32 | 68.94 | 29.77 | 21.82 | 39.8 | 39.8 | 39.8 | 39.8 | 39.8 |
| Depreciation | 6.7 | 8.0 | 11.0 | 11.0 | 13.9 | 15.1 | 18.0 | 21.4 | 25.5 | 30.3 |
| Depreciation, % | 30.05 | 12.34 | 15.66 | 23.04 | 22.72 | 20.76 | 20.76 | 20.76 | 20.76 | 20.76 |
| EBIT | -3.5 | 33.5 | 37.4 | 3.2 | -.5 | 13.8 | 16.5 | 19.6 | 23.3 | 27.8 |
| EBIT, % | -15.91 | 51.97 | 53.28 | 6.73 | -0.8995 | 19.04 | 19.04 | 19.04 | 19.04 | 19.04 |
| Total Cash | .9 | 26.8 | 34.0 | 10.8 | 6.7 | 18.6 | 22.2 | 26.4 | 31.4 | 37.4 |
| Total Cash, percent | .0 | .0 | .0 | .0 | .0 | .0 | .0 | .0 | .0 | .0 |
| Account Receivables | 2.0 | 2.0 | 9.9 | 8.9 | 9.5 | 8.8 | 10.5 | 12.5 | 14.8 | 17.6 |
| Account Receivables, % | 8.92 | 3.13 | 14.12 | 18.63 | 15.63 | 12.09 | 12.09 | 12.09 | 12.09 | 12.09 |
| Inventories | 1.4 | .8 | 1.1 | 4.1 | 2.1 | 3.1 | 3.6 | 4.3 | 5.2 | 6.1 |
| Inventories, % | 6.22 | 1.2 | 1.51 | 8.65 | 3.43 | 4.2 | 4.2 | 4.2 | 4.2 | 4.2 |
| Accounts Payable | 1.1 | .9 | 3.0 | 3.1 | 2.7 | 3.1 | 3.7 | 4.4 | 5.2 | 6.2 |
| Accounts Payable, % | 4.82 | 1.33 | 4.26 | 6.61 | 4.37 | 4.28 | 4.28 | 4.28 | 4.28 | 4.28 |
| Capital Expenditure | -.6 | -36.8 | -37.8 | -65.3 | -8.7 | -33.2 | -39.5 | -47.0 | -55.9 | -66.6 |
| Capital Expenditure, % | -2.74 | -57.14 | -53.84 | -137.21 | -14.29 | -45.6 | -45.6 | -45.6 | -45.6 | -45.6 |
| Tax Rate, % | 8.62 | 8.62 | 8.62 | 8.62 | 8.62 | 8.62 | 8.62 | 8.62 | 8.62 | 8.62 |
| EBITAT | -5.0 | 33.5 | 37.4 | 2.8 | -.5 | 13.3 | 15.8 | 18.8 | 22.4 | 26.7 |
| Depreciation | ||||||||||
| Changes in Account Receivables | ||||||||||
| Changes in Inventories | ||||||||||
| Changes in Accounts Payable | ||||||||||
| Capital Expenditure | ||||||||||
| UFCF | -1.2 | 5.0 | 4.6 | -53.4 | 5.5 | -4.5 | -7.3 | -8.7 | -10.4 | -12.4 |
| WACC, % | 7.47 | 7.47 | 7.47 | 6.83 | 6.99 | 7.24 | 7.24 | 7.24 | 7.24 | 7.24 |
| PV UFCF | ||||||||||
| SUM PV UFCF | -34.3 | |||||||||
| Long Term Growth Rate, % | 0.50 | |||||||||
| Free cash flow (T + 1) | -12 | |||||||||
| Terminal Value | -185 | |||||||||
| Present Terminal Value | -130 | |||||||||
| Enterprise Value | -164 | |||||||||
| Net Debt | 100 | |||||||||
| Equity Value | -265 | |||||||||
| Diluted Shares Outstanding, MM | 3 | |||||||||
| Equity Value Per Share | -97.14 |
What You Will Get
- Real EDRY Financial Data: Pre-filled with EuroDry Ltd.’s historical and projected data for precise analysis.
- Fully Editable Template: Modify key inputs like revenue growth, WACC, and EBITDA % with ease.
- Automatic Calculations: See EuroDry Ltd.’s intrinsic value update instantly based on your changes.
- Professional Valuation Tool: Designed for investors, analysts, and consultants seeking accurate DCF results.
- User-Friendly Design: Simple structure and clear instructions for all experience levels.
Key Features
- Comprehensive DCF Calculator: Offers detailed unlevered and levered DCF valuation models tailored for EuroDry Ltd. (EDRY).
- WACC Calculator: Features a pre-built Weighted Average Cost of Capital sheet with adjustable inputs specific to EuroDry Ltd. (EDRY).
- Customizable Forecast Assumptions: Easily modify growth rates, capital expenditures, and discount rates for accurate projections.
- Integrated Financial Ratios: Evaluate profitability, leverage, and efficiency ratios relevant to EuroDry Ltd. (EDRY).
- Interactive Dashboard and Charts: Visual representations summarize key valuation metrics for streamlined analysis.
How It Works
- Download the Template: Gain immediate access to the Excel-based EuroDry Ltd. (EDRY) DCF Calculator.
- Input Your Assumptions: Modify the yellow-highlighted cells for growth rates, WACC, margins, and other variables.
- Instant Calculations: The model will automatically refresh EuroDry Ltd.'s (EDRY) intrinsic value.
- Test Scenarios: Experiment with different assumptions to assess potential changes in valuation.
- Analyze and Decide: Leverage the results to inform your investment or financial analysis.
Why Choose EuroDry Ltd. (EDRY)?
- Save Time: Quickly access essential shipping data without the hassle of manual calculations.
- Enhance Accuracy: Dependable maritime analytics and metrics minimize valuation errors.
- Fully Customizable: Adjust the parameters to align with your shipping forecasts and strategies.
- Easy to Understand: Intuitive graphics and reports simplify the analysis of shipping performance.
- Endorsed by Industry Leaders: Crafted for maritime professionals who prioritize accuracy and functionality.
Who Should Use This Product?
- Investors: Assess EuroDry Ltd.'s (EDRY) valuation before making investment decisions.
- CFOs and Financial Analysts: Optimize valuation processes and evaluate financial forecasts for EuroDry Ltd. (EDRY).
- Startup Founders: Understand the valuation methods applied to established companies like EuroDry Ltd. (EDRY).
- Consultants: Provide detailed valuation analyses and reports for clients focused on EuroDry Ltd. (EDRY).
- Students and Educators: Utilize real-time data from EuroDry Ltd. (EDRY) to teach and practice valuation methodologies.
What the Template Contains
- Historical Data: Includes EuroDry Ltd.'s (EDRY) past financials and baseline forecasts.
- DCF and Levered DCF Models: Detailed templates to calculate EuroDry Ltd.'s (EDRY) intrinsic value.
- WACC Sheet: Pre-built calculations for Weighted Average Cost of Capital.
- Editable Inputs: Modify key drivers like growth rates, EBITDA %, and CAPEX assumptions.
- Quarterly and Annual Statements: A complete breakdown of EuroDry Ltd.'s (EDRY) financials.
- Interactive Dashboard: Visualize valuation results and projections dynamically.
Disclaimer
All information, articles, and product details provided on this website are for general informational and educational purposes only. We do not claim any ownership over, nor do we intend to infringe upon, any trademarks, copyrights, logos, brand names, or other intellectual property mentioned or depicted on this site. Such intellectual property remains the property of its respective owners, and any references here are made solely for identification or informational purposes, without implying any affiliation, endorsement, or partnership.
We make no representations or warranties, express or implied, regarding the accuracy, completeness, or suitability of any content or products presented. Nothing on this website should be construed as legal, tax, investment, financial, medical, or other professional advice. In addition, no part of this site—including articles or product references—constitutes a solicitation, recommendation, endorsement, advertisement, or offer to buy or sell any securities, franchises, or other financial instruments, particularly in jurisdictions where such activity would be unlawful.
All content is of a general nature and may not address the specific circumstances of any individual or entity. It is not a substitute for professional advice or services. Any actions you take based on the information provided here are strictly at your own risk. You accept full responsibility for any decisions or outcomes arising from your use of this website and agree to release us from any liability in connection with your use of, or reliance upon, the content or products found herein.