
|
DCF -Bewertung der Bildungsentwicklung (Education Corporation) |
Fully Editable: Tailor To Your Needs In Excel Or Sheets
Professional Design: Trusted, Industry-Standard Templates
Investor-Approved Valuation Models
MAC/PC Compatible, Fully Unlocked
No Expertise Is Needed; Easy To Follow
Educational Development Corporation (EDUC) Bundle
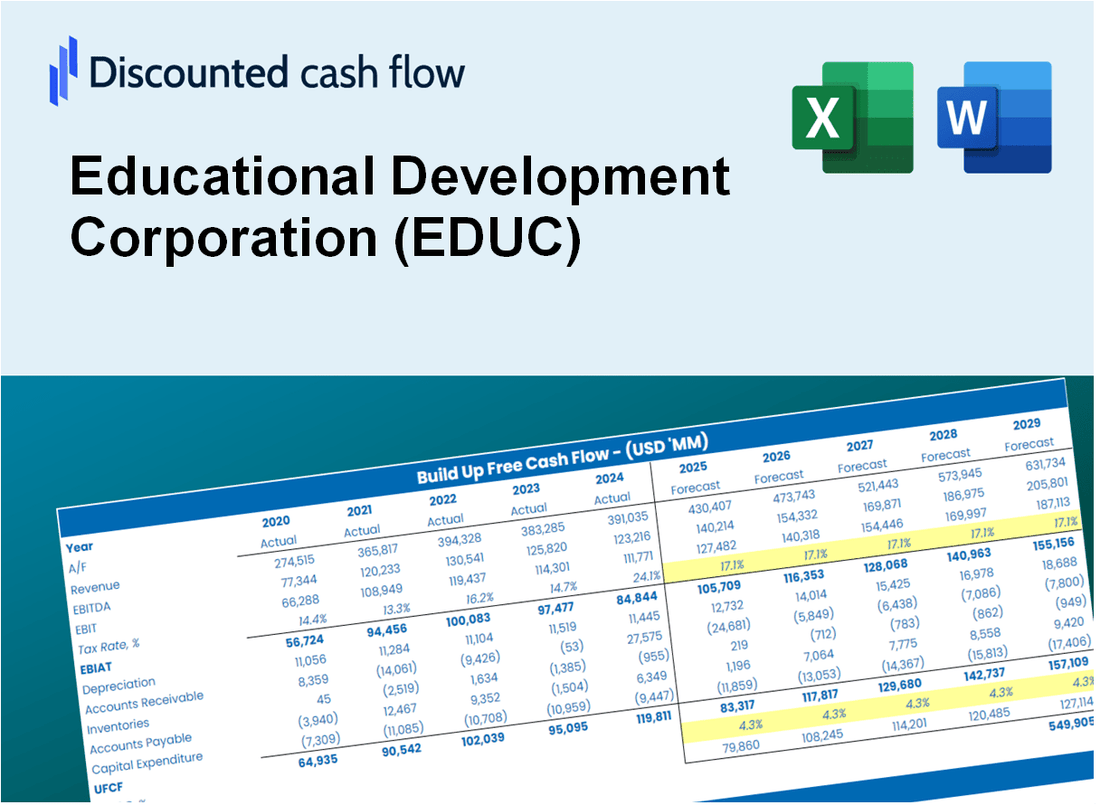
Vereinfachen Sie die Bewertung der Educational Development Corporation (Educ) mit diesem anpassbaren DCF -Taschenrechner! Mit den Finanzdaten für die echte Educational Development Corporation (Educ) und einstellbarer Prognoseeingaben können Sie Szenarien testen und die Fair -Wert der Educational Development Corporation (Educ) in Minuten aufdecken.
What You Will Receive
- Authentic EDUC Financial Data: Pre-loaded with Educational Development Corporation’s historical and forecasted data for accurate analysis.
- Completely Customizable Template: Easily adjust critical inputs such as revenue growth, WACC, and EBITDA %.
- Instant Calculations: Observe EDUC’s intrinsic value update in real time as you make adjustments.
- Expert Valuation Tool: Tailored for investors, analysts, and consultants aiming for precise DCF outcomes.
- Intuitive Design: Straightforward layout and clear guidance suitable for all skill levels.
Key Features
- Comprehensive Educational Data: Access reliable pre-loaded historical performance metrics and future outlooks.
- Adjustable Learning Assumptions: Modify highlighted fields such as student growth rates, funding allocations, and program effectiveness.
- Real-Time Analytics: Automatic updates to performance evaluations, return on investment (ROI), and educational impact assessments.
- User-Friendly Interface: Intuitive charts and summaries designed to help visualize your educational development metrics.
- Suitable for All Users: A straightforward, easy-to-navigate layout tailored for educators, administrators, and stakeholders.
How It Works
- Step 1: Download the prebuilt Excel template with Educational Development Corporation’s (EDUC) data included.
- Step 2: Explore the pre-filled sheets and familiarize yourself with the key metrics.
- Step 3: Update forecasts and assumptions in the editable yellow cells (WACC, growth, margins).
- Step 4: Instantly view recalculated results, including Educational Development Corporation’s (EDUC) intrinsic value.
- Step 5: Make informed investment decisions or generate reports using the outputs.
Why Choose This Calculator for Educational Development Corporation (EDUC)?
- Designed for Educators: A specialized tool crafted for teachers, administrators, and educational consultants.
- Comprehensive Data: EDUC’s historical and projected educational metrics preloaded for precision.
- Scenario Analysis: Easily simulate various educational outcomes and assumptions.
- Clear Results: Automatically calculates key performance indicators, growth metrics, and other essential figures.
- User-Friendly: Step-by-step guidance makes navigating the calculator simple.
Who Should Use This Product?
- Educators and Trainers: Utilize comprehensive resources to enhance curriculum and teaching methods.
- Students: Access valuable materials to support learning and academic success.
- School Administrators: Implement effective educational tools to improve student outcomes.
- Parents: Discover resources to assist children in their educational journey.
- Educational Consultants: Offer expert advice and strategies based on current educational trends and data.
What the Template Contains
- Preloaded EDUC Data: Historical and projected financial data, including revenue, EBIT, and capital expenditures.
- DCF and WACC Models: Professional-grade sheets for calculating intrinsic value and Weighted Average Cost of Capital.
- Editable Inputs: Yellow-highlighted cells for adjusting revenue growth, tax rates, and discount rates.
- Financial Statements: Comprehensive annual and quarterly financials for deeper analysis.
- Key Ratios: Profitability, leverage, and efficiency ratios to evaluate performance.
- Dashboard and Charts: Visual summaries of valuation outcomes and assumptions.
Disclaimer
All information, articles, and product details provided on this website are for general informational and educational purposes only. We do not claim any ownership over, nor do we intend to infringe upon, any trademarks, copyrights, logos, brand names, or other intellectual property mentioned or depicted on this site. Such intellectual property remains the property of its respective owners, and any references here are made solely for identification or informational purposes, without implying any affiliation, endorsement, or partnership.
We make no representations or warranties, express or implied, regarding the accuracy, completeness, or suitability of any content or products presented. Nothing on this website should be construed as legal, tax, investment, financial, medical, or other professional advice. In addition, no part of this site—including articles or product references—constitutes a solicitation, recommendation, endorsement, advertisement, or offer to buy or sell any securities, franchises, or other financial instruments, particularly in jurisdictions where such activity would be unlawful.
All content is of a general nature and may not address the specific circumstances of any individual or entity. It is not a substitute for professional advice or services. Any actions you take based on the information provided here are strictly at your own risk. You accept full responsibility for any decisions or outcomes arising from your use of this website and agree to release us from any liability in connection with your use of, or reliance upon, the content or products found herein.