
|
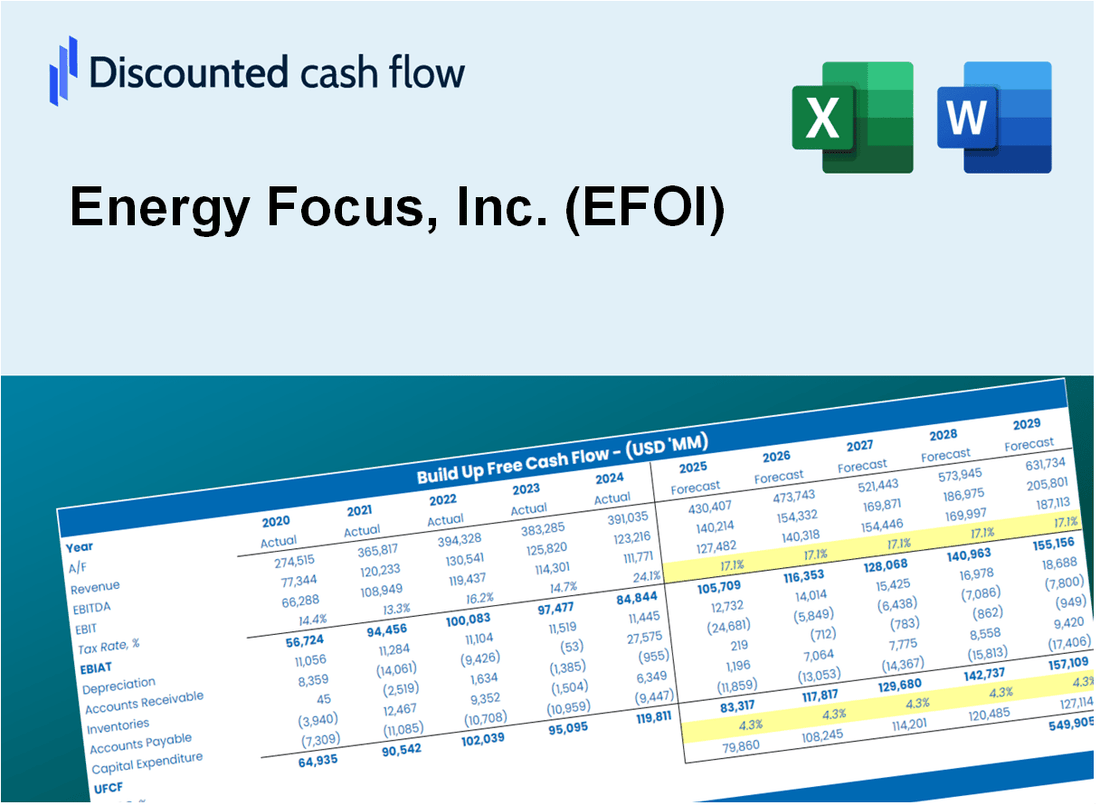
Energy Focus, Inc. (EFOI) DCF -Bewertung |
Fully Editable: Tailor To Your Needs In Excel Or Sheets
Professional Design: Trusted, Industry-Standard Templates
Investor-Approved Valuation Models
MAC/PC Compatible, Fully Unlocked
No Expertise Is Needed; Easy To Follow
Energy Focus, Inc. (EFOI) Bundle
Unser (EFOI) DCF-Taschenrechner entwickelt für die Genauigkeit und ermöglicht es Ihnen, die Bewertung von Energy Focus, Inc. unter Verwendung realer Finanzdaten zu bewerten und gleichzeitig vollständige Flexibilität bereitzustellen, um alle wesentlichen Parameter für erweiterte Projektionen zu ändern.
What You Will Get
- Pre-Filled Financial Model: Energy Focus, Inc. (EFOI)’s actual data enables precise DCF valuation.
- Full Forecast Control: Adjust revenue growth, margins, WACC, and other key drivers for accurate projections.
- Instant Calculations: Automatic updates ensure you see results in real-time as you make adjustments.
- Investor-Ready Template: A polished Excel file crafted for professional-grade valuation presentations.
- Customizable and Reusable: Designed for flexibility, allowing repeated use for comprehensive forecasts.
Key Features
- Comprehensive Data: Energy Focus, Inc.'s historical financial statements and pre-filled projections.
- Customizable Inputs: Adjust WACC, tax rates, revenue growth, and EBITDA margins as needed.
- Real-Time Results: Watch Energy Focus, Inc.'s intrinsic value update instantly.
- Intuitive Visual Outputs: Dashboard graphs illustrate valuation results and essential metrics.
- Designed for Precision: A reliable tool for analysts, investors, and finance professionals.
How It Works
- Download: Get the pre-built Excel file featuring Energy Focus, Inc. (EFOI) financial data.
- Customize: Modify forecasts, including projected revenue growth, EBITDA %, and WACC.
- Update Automatically: Real-time updates for intrinsic value and NPV calculations.
- Test Scenarios: Generate various projections and instantly compare results.
- Make Decisions: Leverage valuation insights to inform your investment choices.
Why Choose This Calculator for Energy Focus, Inc. (EFOI)?
- User-Friendly Interface: Tailored for both novices and seasoned professionals.
- Customizable Inputs: Adjust parameters to suit your specific analysis needs.
- Real-Time Adjustments: Witness immediate updates to Energy Focus’s valuation as you tweak inputs.
- Pre-Configured Data: Comes with Energy Focus’s up-to-date financial information for swift evaluations.
- Relied Upon by Experts: Favored by investors and analysts for making well-informed choices.
Who Should Use This Product?
- Investors: Accurately assess Energy Focus, Inc.'s (EFOI) fair value before making investment choices.
- CFOs: Utilize a professional-grade DCF model for comprehensive financial reporting and analysis.
- Consultants: Efficiently customize the template for valuation reports tailored to clients.
- Entrepreneurs: Discover insights into financial modeling practices employed by leading energy firms.
- Educators: Implement it as a teaching resource to illustrate valuation techniques.
What the Template Contains
- Historical Data: Includes Energy Focus, Inc. (EFOI)’s past financials and baseline forecasts.
- DCF and Levered DCF Models: Detailed templates to calculate Energy Focus, Inc. (EFOI)’s intrinsic value.
- WACC Sheet: Pre-built calculations for Weighted Average Cost of Capital.
- Editable Inputs: Modify key drivers like growth rates, EBITDA %, and CAPEX assumptions.
- Quarterly and Annual Statements: A complete breakdown of Energy Focus, Inc. (EFOI)’s financials.
- Interactive Dashboard: Visualize valuation results and projections dynamically.
Disclaimer
All information, articles, and product details provided on this website are for general informational and educational purposes only. We do not claim any ownership over, nor do we intend to infringe upon, any trademarks, copyrights, logos, brand names, or other intellectual property mentioned or depicted on this site. Such intellectual property remains the property of its respective owners, and any references here are made solely for identification or informational purposes, without implying any affiliation, endorsement, or partnership.
We make no representations or warranties, express or implied, regarding the accuracy, completeness, or suitability of any content or products presented. Nothing on this website should be construed as legal, tax, investment, financial, medical, or other professional advice. In addition, no part of this site—including articles or product references—constitutes a solicitation, recommendation, endorsement, advertisement, or offer to buy or sell any securities, franchises, or other financial instruments, particularly in jurisdictions where such activity would be unlawful.
All content is of a general nature and may not address the specific circumstances of any individual or entity. It is not a substitute for professional advice or services. Any actions you take based on the information provided here are strictly at your own risk. You accept full responsibility for any decisions or outcomes arising from your use of this website and agree to release us from any liability in connection with your use of, or reliance upon, the content or products found herein.