
|
ENPHASE Energy, Inc. (ENPH) DCF -Bewertung |
Fully Editable: Tailor To Your Needs In Excel Or Sheets
Professional Design: Trusted, Industry-Standard Templates
Investor-Approved Valuation Models
MAC/PC Compatible, Fully Unlocked
No Expertise Is Needed; Easy To Follow
Enphase Energy, Inc. (ENPH) Bundle
Stürzen Sie Ihre Analyse und verbessern Sie die Präzision mit unserem DCF -Taschenrechner von Enphase Energy, Inc. (ENPH)! Mit dem Zugriff auf echte Daten von Enphase und anpassbaren Annahmen ermöglichen dieses Tool Sie, Enphase Energy, Inc. (ENPH) wie ein erfahrener Investor zu prognostizieren, zu bewerten und zu bewerten.
What You Will Get
- Real ENPH Financial Data: Pre-filled with Enphase Energy’s historical and projected data for precise analysis.
- Fully Editable Template: Modify key inputs like revenue growth, WACC, and EBITDA % with ease.
- Automatic Calculations: See Enphase Energy’s intrinsic value update instantly based on your changes.
- Professional Valuation Tool: Designed for investors, analysts, and consultants seeking accurate DCF results.
- User-Friendly Design: Simple structure and clear instructions for all experience levels.
Key Features
- Comprehensive Financial Data: Gain access to precise historical performance and future forecasts tailored for Enphase Energy, Inc. (ENPH).
- Adjustable Forecast Parameters: Modify highlighted fields such as WACC, growth rates, and profit margins to fit your analysis.
- Real-Time Calculations: Enjoy automatic updates for DCF, Net Present Value (NPV), and cash flow metrics.
- Interactive Dashboard: Utilize clear charts and summaries to effectively visualize your valuation findings.
- Designed for All Users: A user-friendly layout crafted for investors, CFOs, and consultants, regardless of experience level.
How It Works
- Download: Get the ready-to-use Excel file featuring Enphase Energy's (ENPH) financial data.
- Customize: Tailor forecasts such as revenue growth, EBITDA %, and WACC to your needs.
- Update Automatically: Watch as the intrinsic value and NPV calculations refresh in real-time.
- Test Scenarios: Generate various projections and instantly compare the results.
- Make Decisions: Leverage the valuation insights to inform your investment strategy.
Why Choose This Calculator for Enphase Energy, Inc. (ENPH)?
- User-Friendly Interface: Tailored for both novices and seasoned users.
- Customizable Inputs: Adjust parameters easily to suit your financial analysis.
- Real-Time Valuation: Observe immediate adjustments to Enphase's valuation as you change inputs.
- Preloaded Data: Comes equipped with Enphase’s latest financial figures for swift evaluations.
- Preferred by Experts: Utilized by analysts and investors for making well-informed choices.
Who Should Use This Product?
- Professional Investors: Develop comprehensive and accurate valuation models for analyzing portfolios with Enphase Energy (ENPH).
- Corporate Finance Teams: Evaluate valuation scenarios to inform strategic decisions within the organization.
- Consultants and Advisors: Deliver precise valuation insights to clients regarding Enphase Energy (ENPH) stock.
- Students and Educators: Utilize real-world data to enhance learning and practice in financial modeling.
- Energy Sector Enthusiasts: Gain insights into how renewable energy companies like Enphase Energy (ENPH) are valued in the marketplace.
What the Template Contains
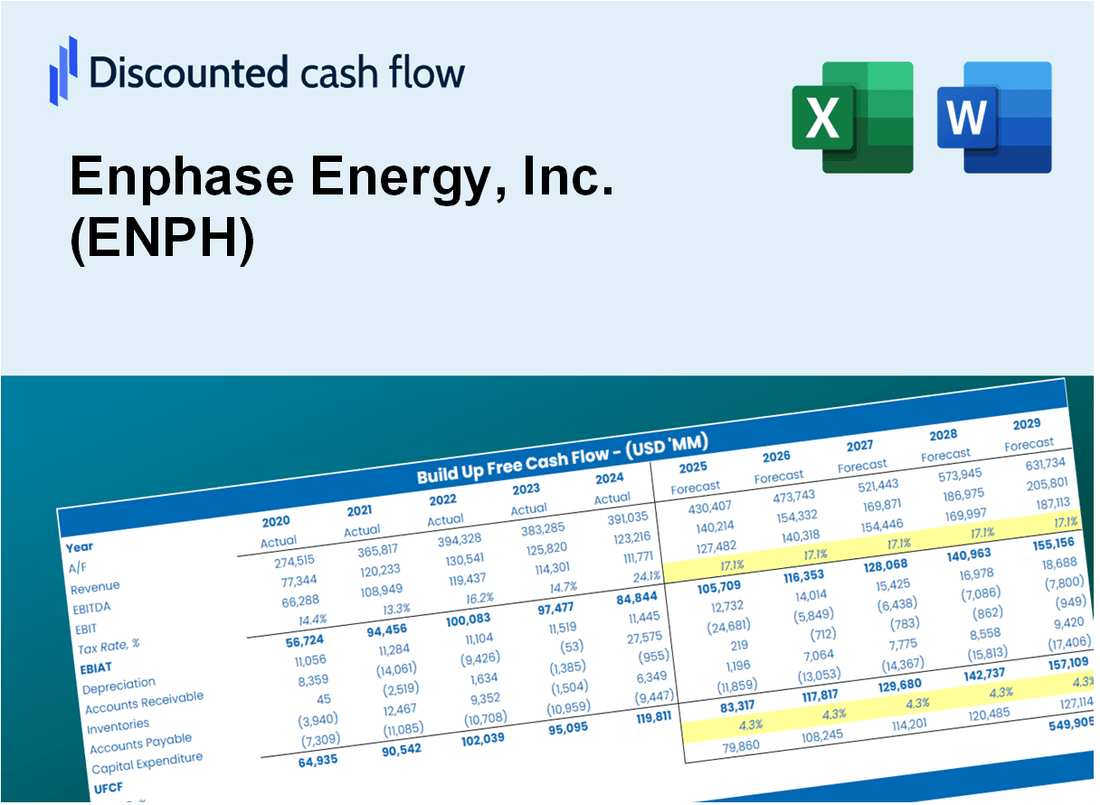
- Operating and Balance Sheet Data: Pre-filled Enphase Energy historical data and forecasts, including revenue, EBITDA, EBIT, and capital expenditures.
- WACC Calculation: A dedicated sheet for Weighted Average Cost of Capital (WACC), including parameters like Beta, risk-free rate, and share price.
- DCF Valuation (Unlevered and Levered): Editable Discounted Cash Flow models showing intrinsic value with detailed calculations.
- Financial Statements: Pre-loaded financial statements (annual and quarterly) to support analysis.
- Key Ratios: Includes profitability, leverage, and efficiency ratios for Enphase Energy, Inc. (ENPH).
- Dashboard and Charts: Visual summary of valuation outputs and assumptions to analyze results easily.
Disclaimer
All information, articles, and product details provided on this website are for general informational and educational purposes only. We do not claim any ownership over, nor do we intend to infringe upon, any trademarks, copyrights, logos, brand names, or other intellectual property mentioned or depicted on this site. Such intellectual property remains the property of its respective owners, and any references here are made solely for identification or informational purposes, without implying any affiliation, endorsement, or partnership.
We make no representations or warranties, express or implied, regarding the accuracy, completeness, or suitability of any content or products presented. Nothing on this website should be construed as legal, tax, investment, financial, medical, or other professional advice. In addition, no part of this site—including articles or product references—constitutes a solicitation, recommendation, endorsement, advertisement, or offer to buy or sell any securities, franchises, or other financial instruments, particularly in jurisdictions where such activity would be unlawful.
All content is of a general nature and may not address the specific circumstances of any individual or entity. It is not a substitute for professional advice or services. Any actions you take based on the information provided here are strictly at your own risk. You accept full responsibility for any decisions or outcomes arising from your use of this website and agree to release us from any liability in connection with your use of, or reliance upon, the content or products found herein.