
|
Entain plc (ent.l) dcf bewerten |
Fully Editable: Tailor To Your Needs In Excel Or Sheets
Professional Design: Trusted, Industry-Standard Templates
Investor-Approved Valuation Models
MAC/PC Compatible, Fully Unlocked
No Expertise Is Needed; Easy To Follow
Entain Plc (ENT.L) Bundle
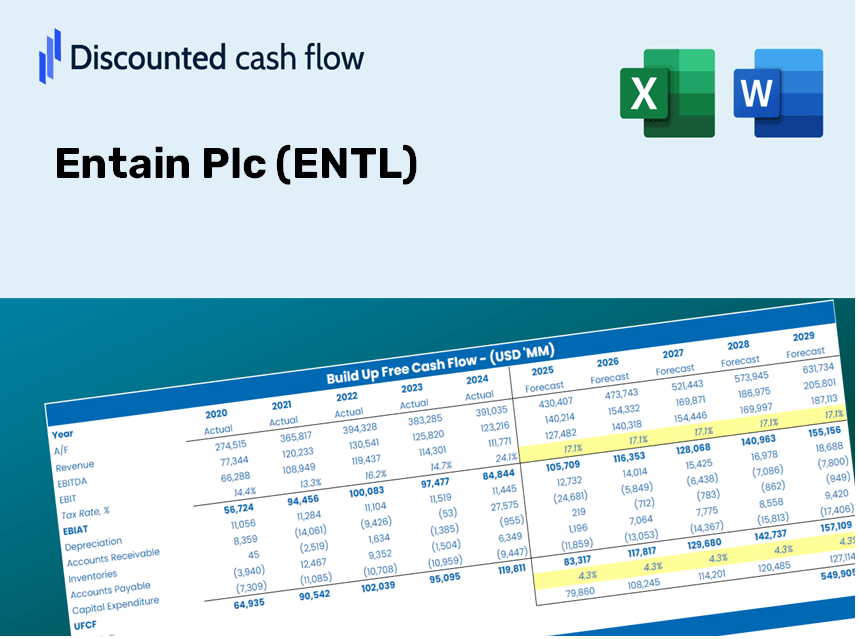
Unser (ENTL) DCF-Taschenrechner für Genauigkeit ermöglicht und ermöglicht es Ihnen, die Bewertung von Entain PLC anhand aktueller Finanzdaten zu bewerten und vollständige Flexibilität zu bieten, um alle wesentlichen Parameter für verbesserte Projektionen zu ändern.
What You Will Receive
- Pre-Filled Financial Model: Utilizes Entain Plc’s actual data for accurate DCF valuation.
- Comprehensive Forecast Control: Modify revenue growth rates, profit margins, WACC, and other essential variables.
- Real-Time Calculations: Instantaneous updates allow you to see results immediately as adjustments are made.
- Professional-Grade Template: An expertly crafted Excel file specifically designed for high-quality valuation.
- Customizable and Reusable: Designed for versatility, enabling repeated application for in-depth forecasts.
Key Features
- 🔍 Real-Life ENTL Financials: Pre-filled historical and projected data for Entain Plc.
- ✏️ Fully Customizable Inputs: Modify all essential parameters (yellow cells), including WACC, growth %, and tax rates.
- 📊 Professional DCF Valuation: Integrated formulas calculate Entain’s intrinsic value using the Discounted Cash Flow method.
- ⚡ Instant Results: Quickly visualize Entain’s valuation after any adjustments.
- Scenario Analysis: Evaluate and compare different financial assumptions side-by-side.
How It Works
- Download: Get the pre-formatted Excel file containing Entain Plc's financial data.
- Customize: Modify your forecasts, including expected revenue growth, EBITDA percentage, and WACC.
- Update Automatically: Watch as intrinsic value and NPV calculations refresh in real-time.
- Test Scenarios: Generate various projections and instantly compare the results.
- Make Decisions: Leverage the valuation insights to shape your investment approach.
Why Opt for This Calculator?
- Designed for Experts: A sophisticated tool favored by analysts, CFOs, and consultants in the industry.
- Accurate Data: Entain Plc’s historical and projected financial information is preloaded for reliability.
- Dynamic Scenario Testing: Effortlessly simulate various forecasts and assumptions.
- Clear Results: Instantly computes intrinsic value, NPV, and essential metrics.
- User-Friendly: Step-by-step guidance ensures an intuitive experience.
Who Can Benefit from This Product?
- Professional Investors: Develop comprehensive and accurate valuation models for portfolio assessment.
- Corporate Finance Teams: Evaluate valuation scenarios to inform strategic decisions within the company.
- Consultants and Advisors: Offer clients precise valuation insights for Entain Plc (ENTL) stock.
- Students and Educators: Engage with real-world data to enhance the learning and application of financial modeling.
- Gaming Industry Enthusiasts: Gain insights into how companies like Entain Plc (ENTL) are valued in the marketplace.
Overview of Template Features
- Pre-Filled DCF Model: Entain Plc’s financial data preloaded for immediate analysis.
- WACC Calculator: Comprehensive calculations for the Weighted Average Cost of Capital.
- Financial Ratios: Assess the profitability, leverage, and efficiency metrics of Entain Plc.
- Editable Inputs: Customize assumptions like growth rates, margins, and capital expenditures to suit your scenarios.
- Financial Statements: Access annual and quarterly reports to facilitate in-depth analysis.
- Interactive Dashboard: Effortlessly visualize key valuation metrics and outcomes.
Disclaimer
All information, articles, and product details provided on this website are for general informational and educational purposes only. We do not claim any ownership over, nor do we intend to infringe upon, any trademarks, copyrights, logos, brand names, or other intellectual property mentioned or depicted on this site. Such intellectual property remains the property of its respective owners, and any references here are made solely for identification or informational purposes, without implying any affiliation, endorsement, or partnership.
We make no representations or warranties, express or implied, regarding the accuracy, completeness, or suitability of any content or products presented. Nothing on this website should be construed as legal, tax, investment, financial, medical, or other professional advice. In addition, no part of this site—including articles or product references—constitutes a solicitation, recommendation, endorsement, advertisement, or offer to buy or sell any securities, franchises, or other financial instruments, particularly in jurisdictions where such activity would be unlawful.
All content is of a general nature and may not address the specific circumstances of any individual or entity. It is not a substitute for professional advice or services. Any actions you take based on the information provided here are strictly at your own risk. You accept full responsibility for any decisions or outcomes arising from your use of this website and agree to release us from any liability in connection with your use of, or reliance upon, the content or products found herein.