
|
Euronext N.V. (ENX.PA) DCF -Bewertung |
Fully Editable: Tailor To Your Needs In Excel Or Sheets
Professional Design: Trusted, Industry-Standard Templates
Investor-Approved Valuation Models
MAC/PC Compatible, Fully Unlocked
No Expertise Is Needed; Easy To Follow
Euronext N.V. (ENX.PA) Bundle
Mit unserem (ENXPA) DCF-Taschenrechner, der für die Genauigkeit entwickelt wurde, können Sie die Bewertung von Euronext N.V. anhand von Finanzdaten in Echtzeit bewerten und vollständige Flexibilität bieten, um alle wesentlichen Parameter für verbesserte Prognosen zu optimieren.
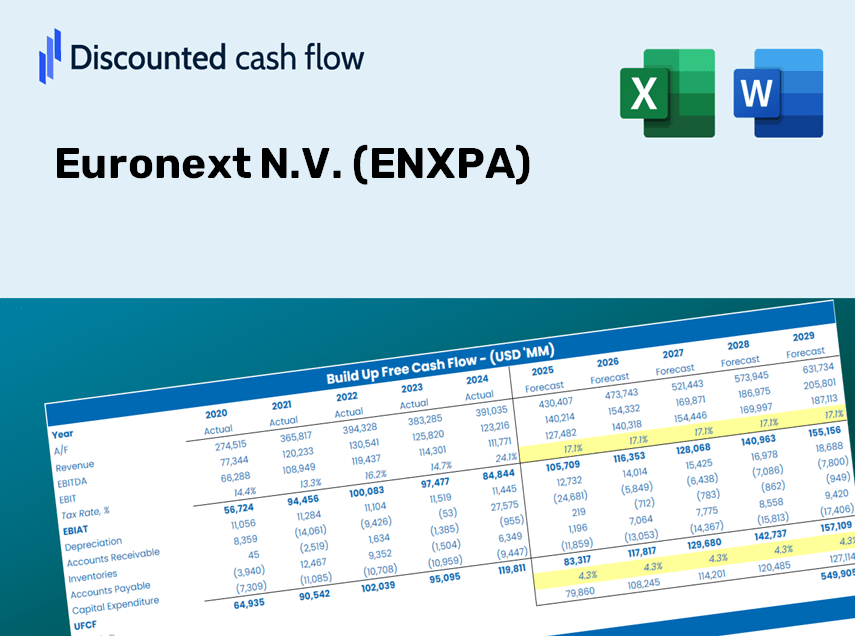
Discounted Cash Flow (DCF) - (USD MM)
| Year | AY1 2020 |
AY2 2021 |
AY3 2022 |
AY4 2023 |
AY5 2024 |
FY1 2025 |
FY2 2026 |
FY3 2027 |
FY4 2028 |
FY5 2029 |
|---|---|---|---|---|---|---|---|---|---|---|
| Revenue | 884.3 | 1,385.7 | 1,482.3 | 1,473.5 | 1,624.8 | 1,922.7 | 2,275.3 | 2,692.5 | 3,186.2 | 3,770.4 |
| Revenue Growth, % | 0 | 56.7 | 6.96 | -0.58816 | 10.27 | 18.34 | 18.34 | 18.34 | 18.34 | 18.34 |
| EBITDA | 520.4 | 857.4 | 827.2 | 905.0 | 1,789.6 | 1,299.5 | 1,537.8 | 1,819.8 | 2,153.4 | 2,548.3 |
| EBITDA, % | 58.84 | 61.87 | 55.8 | 61.41 | 110.14 | 67.59 | 67.59 | 67.59 | 67.59 | 67.59 |
| Depreciation | 421.8 | 661.0 | 808.4 | 170.1 | 168.2 | 660.8 | 781.9 | 925.3 | 1,095.0 | 1,295.8 |
| Depreciation, % | 47.7 | 47.7 | 54.54 | 11.55 | 10.35 | 34.37 | 34.37 | 34.37 | 34.37 | 34.37 |
| EBIT | 98.6 | 196.4 | 18.8 | 734.8 | 1,621.4 | 677.7 | 802.0 | 949.1 | 1,123.1 | 1,329.0 |
| EBIT, % | 11.15 | 14.17 | 1.27 | 49.87 | 99.79 | 35.25 | 35.25 | 35.25 | 35.25 | 35.25 |
| Total Cash | 721.6 | 138,712.8 | 168,006.4 | 1,551.8 | 1,737.3 | 1,851.9 | 2,191.5 | 2,593.4 | 3,068.9 | 3,631.6 |
| Total Cash, percent | .0 | .0 | .0 | .0 | .0 | .0 | .0 | .0 | .0 | .0 |
| Account Receivables | 159.5 | 380.3 | 296.6 | 283.6 | 412.9 | 423.6 | 501.2 | 593.1 | 701.9 | 830.6 |
| Account Receivables, % | 18.03 | 27.44 | 20.01 | 19.25 | 25.41 | 22.03 | 22.03 | 22.03 | 22.03 | 22.03 |
| Inventories | -23.7 | -11.9 | -166,782.9 | .0 | .0 | -398.2 | -471.2 | -557.6 | -659.8 | -780.8 |
| Inventories, % | -2.68 | -0.85968 | -11251.98 | 0 | 0 | -20.71 | -20.71 | -20.71 | -20.71 | -20.71 |
| Accounts Payable | 56.3 | 211.1 | 162.5 | 149.4 | 464.3 | 274.1 | 324.3 | 383.8 | 454.2 | 537.5 |
| Accounts Payable, % | 6.36 | 15.24 | 10.96 | 10.14 | 28.58 | 14.25 | 14.25 | 14.25 | 14.25 | 14.25 |
| Capital Expenditure | -19.2 | -67.6 | -99.5 | -103.0 | -87.3 | -100.5 | -118.9 | -140.7 | -166.5 | -197.0 |
| Capital Expenditure, % | -2.17 | -4.88 | -6.71 | -6.99 | -5.37 | -5.23 | -5.23 | -5.23 | -5.23 | -5.23 |
| Tax Rate, % | 30.21 | 30.21 | 30.21 | 30.21 | 30.21 | 30.21 | 30.21 | 30.21 | 30.21 | 30.21 |
| EBITAT | 70.2 | 141.6 | 13.6 | 539.8 | 1,131.6 | 486.5 | 575.7 | 681.3 | 806.2 | 954.0 |
| Depreciation | ||||||||||
| Changes in Account Receivables | ||||||||||
| Changes in Inventories | ||||||||||
| Changes in Accounts Payable | ||||||||||
| Capital Expenditure | ||||||||||
| UFCF | 393.3 | 657.3 | 167,528.4 | -166,176.1 | 1,398.1 | 1,244.1 | 1,284.4 | 1,519.9 | 1,798.5 | 2,128.3 |
| WACC, % | 7.13 | 7.14 | 7.14 | 7.15 | 7.12 | 7.14 | 7.14 | 7.14 | 7.14 | 7.14 |
| PV UFCF | ||||||||||
| SUM PV UFCF | 6,388.7 | |||||||||
| Long Term Growth Rate, % | 2.00 | |||||||||
| Free cash flow (T + 1) | 2,171 | |||||||||
| Terminal Value | 42,249 | |||||||||
| Present Terminal Value | 29,929 | |||||||||
| Enterprise Value | 36,318 | |||||||||
| Net Debt | 1,442 | |||||||||
| Equity Value | 34,876 | |||||||||
| Diluted Shares Outstanding, MM | 104 | |||||||||
| Equity Value Per Share | 335.39 |
What You Will Receive
- Accurate ENXPA Financial Data: Pre-loaded with Euronext N.V.'s historical and projected metrics for thorough analysis.
- Completely Customizable Template: Effortlessly adjust key variables such as revenue growth, WACC, and EBITDA %.
- Instantaneous Calculations: Watch Euronext's intrinsic value update in real-time as you make modifications.
- Expert Valuation Tool: Tailored for investors, analysts, and consultants aiming for precise DCF assessments.
- User-Friendly Layout: Streamlined design with straightforward instructions suitable for all skill levels.
Key Features
- Pre-Loaded Data: Euronext N.V.'s historical financial statements and pre-filled forecasts.
- Fully Adjustable Inputs: Modify WACC, tax rates, revenue growth, and EBITDA margins.
- Instant Results: Watch Euronext N.V.'s intrinsic value recalculate in real time.
- Clear Visual Outputs: Dashboard charts present valuation results and key metrics.
- Built for Accuracy: A professional tool designed for analysts, investors, and finance professionals.
How It Functions
- 1. Access the Template: Download and open the Excel file containing Euronext N.V. (ENXPA) preloaded data.
- 2. Adjust Assumptions: Modify essential inputs such as growth rates, WACC, and capital expenditures.
- 3. Instant Results: The DCF model automatically calculates intrinsic value and NPV as you make changes.
- 4. Evaluate Scenarios: Analyze different valuation outcomes by comparing multiple forecasts.
- 5. Present with Confidence: Showcase professional valuation insights to reinforce your decisions.
Why Choose This Calculator for Euronext N.V. (ENXPA)?
- All-in-One Tool: Offers DCF, WACC, and financial ratio analyses integrated into a single platform.
- Flexible Inputs: Modify the highlighted cells to explore different investment scenarios.
- In-Depth Analysis: Automatically computes Euronext’s intrinsic value and Net Present Value.
- Preloaded Information: Access historical and projected data for reliable calculations.
- High-Quality Standards: Perfect for financial analysts, investors, and business advisors.
Who Can Benefit from This Product?
- Institutional Investors: Create comprehensive and precise valuation models for portfolio evaluation.
- Corporate Finance Departments: Assess valuation scenarios to inform strategic decision-making.
- Consultants and Financial Advisors: Deliver clients well-informed valuation analyses for Euronext N.V. (ENXPA) stock.
- Students and Academic Professionals: Utilize real-time data to enhance learning and practice in financial modeling.
- Market Analysts: Explore how stock exchanges like Euronext are assessed in the financial landscape.
Contents of the Template
- Pre-Filled DCF Model: Euronext N.V.'s financial data ready for immediate analysis.
- WACC Calculator: Comprehensive calculations for Weighted Average Cost of Capital.
- Financial Ratios: Assess Euronext N.V.'s profitability, leverage, and operational efficiency.
- Editable Inputs: Modify assumptions such as growth rates, profit margins, and CAPEX to suit your needs.
- Financial Statements: Annual and quarterly reports for in-depth financial analysis.
- Interactive Dashboard: Effortlessly visualize essential valuation metrics and results.
Disclaimer
All information, articles, and product details provided on this website are for general informational and educational purposes only. We do not claim any ownership over, nor do we intend to infringe upon, any trademarks, copyrights, logos, brand names, or other intellectual property mentioned or depicted on this site. Such intellectual property remains the property of its respective owners, and any references here are made solely for identification or informational purposes, without implying any affiliation, endorsement, or partnership.
We make no representations or warranties, express or implied, regarding the accuracy, completeness, or suitability of any content or products presented. Nothing on this website should be construed as legal, tax, investment, financial, medical, or other professional advice. In addition, no part of this site—including articles or product references—constitutes a solicitation, recommendation, endorsement, advertisement, or offer to buy or sell any securities, franchises, or other financial instruments, particularly in jurisdictions where such activity would be unlawful.
All content is of a general nature and may not address the specific circumstances of any individual or entity. It is not a substitute for professional advice or services. Any actions you take based on the information provided here are strictly at your own risk. You accept full responsibility for any decisions or outcomes arising from your use of this website and agree to release us from any liability in connection with your use of, or reliance upon, the content or products found herein.