
|
Evolus, Inc. (EOLS) DCF -Bewertung |
Fully Editable: Tailor To Your Needs In Excel Or Sheets
Professional Design: Trusted, Industry-Standard Templates
Investor-Approved Valuation Models
MAC/PC Compatible, Fully Unlocked
No Expertise Is Needed; Easy To Follow
Evolus, Inc. (EOLS) Bundle
Suchen Sie, um den intrinsischen Wert von Evolus, Inc. (EOLS) zu bewerten? Unser (EOLS) DCF-Taschenrechner integriert reale Daten mit umfassenden Anpassungsfunktionen, sodass Sie Ihre Prognosen verfeinern und Ihre Anlagestrategien verbessern können.
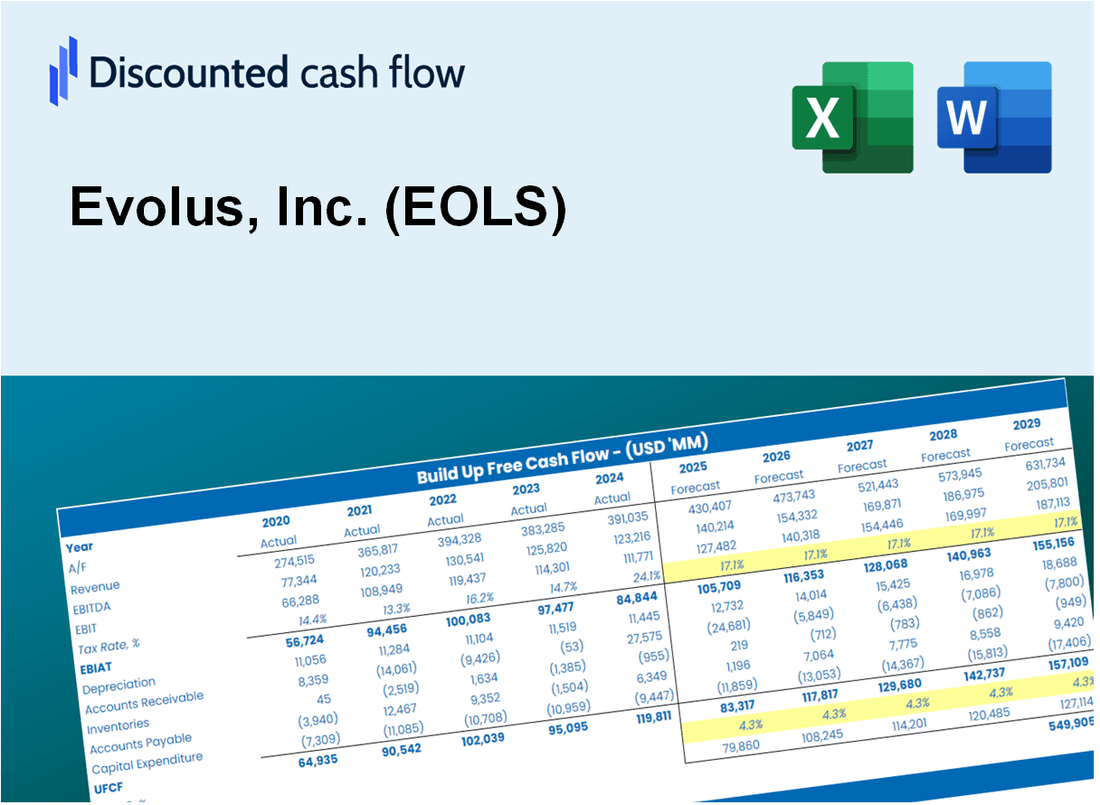
Discounted Cash Flow (DCF) - (USD MM)
| Year | AY1 2020 |
AY2 2021 |
AY3 2022 |
AY4 2023 |
AY5 2024 |
FY1 2025 |
FY2 2026 |
FY3 2027 |
FY4 2028 |
FY5 2029 |
|---|---|---|---|---|---|---|---|---|---|---|
| Revenue | 56.5 | 99.7 | 148.6 | 202.1 | 266.3 | 394.8 | 585.5 | 868.2 | 1,287.3 | 1,908.9 |
| Revenue Growth, % | 0 | 76.29 | 49.1 | 35.98 | 31.76 | 48.28 | 48.28 | 48.28 | 48.28 | 48.28 |
| EBITDA | -144.8 | -39.1 | -60.7 | -41.8 | -25.0 | -165.9 | -246.0 | -364.8 | -541.0 | -802.2 |
| EBITDA, % | -256.02 | -39.19 | -40.86 | -20.69 | -9.39 | -42.02 | -42.02 | -42.02 | -42.02 | -42.02 |
| Depreciation | 7.7 | 6.3 | 4.5 | 5.9 | 6.0 | 22.2 | 32.9 | 48.8 | 72.4 | 107.3 |
| Depreciation, % | 13.59 | 6.33 | 3.03 | 2.9 | 2.26 | 5.62 | 5.62 | 5.62 | 5.62 | 5.62 |
| EBIT | -152.4 | -45.4 | -65.2 | -47.7 | -31.0 | -177.4 | -263.1 | -390.1 | -578.4 | -857.7 |
| EBIT, % | -269.6 | -45.52 | -43.88 | -23.59 | -11.65 | -44.93 | -44.93 | -44.93 | -44.93 | -44.93 |
| Total Cash | 107.6 | 146.3 | 53.9 | 62.8 | 87.0 | 236.9 | 351.3 | 521.0 | 772.5 | 1,145.5 |
| Total Cash, percent | .0 | .0 | .0 | .0 | .0 | .0 | .0 | .0 | .0 | .0 |
| Account Receivables | 9.7 | 14.7 | 22.4 | 30.5 | 47.7 | 63.1 | 93.6 | 138.8 | 205.8 | 305.2 |
| Account Receivables, % | 17.12 | 14.71 | 15.1 | 15.11 | 17.91 | 15.99 | 15.99 | 15.99 | 15.99 | 15.99 |
| Inventories | 3.4 | 1.8 | 18.9 | 11.0 | 12.2 | 24.0 | 35.6 | 52.8 | 78.3 | 116.0 |
| Inventories, % | 5.93 | 1.77 | 12.69 | 5.44 | 4.57 | 6.08 | 6.08 | 6.08 | 6.08 | 6.08 |
| Accounts Payable | 9.6 | 6.1 | 8.9 | 4.3 | 9.2 | 27.4 | 40.6 | 60.3 | 89.4 | 132.5 |
| Accounts Payable, % | 17.01 | 6.11 | 6.01 | 2.11 | 3.47 | 6.94 | 6.94 | 6.94 | 6.94 | 6.94 |
| Capital Expenditure | -3.1 | -1.0 | -2.9 | -1.6 | -1.5 | -7.8 | -11.5 | -17.1 | -25.4 | -37.6 |
| Capital Expenditure, % | -5.55 | -0.97318 | -1.98 | -0.80511 | -0.55281 | -1.97 | -1.97 | -1.97 | -1.97 | -1.97 |
| Tax Rate, % | -1.33 | -1.33 | -1.33 | -1.33 | -1.33 | -1.33 | -1.33 | -1.33 | -1.33 | -1.33 |
| EBITAT | -152.5 | -45.4 | -65.3 | -47.8 | -31.4 | -177.4 | -263.1 | -390.1 | -578.4 | -857.7 |
| Depreciation | ||||||||||
| Changes in Account Receivables | ||||||||||
| Changes in Inventories | ||||||||||
| Changes in Accounts Payable | ||||||||||
| Capital Expenditure | ||||||||||
| UFCF | -151.4 | -47.0 | -85.8 | -48.5 | -40.2 | -172.1 | -270.5 | -401.1 | -594.8 | -882.0 |
| WACC, % | 10.04 | 10.04 | 10.04 | 10.04 | 10.04 | 10.04 | 10.04 | 10.04 | 10.04 | 10.04 |
| PV UFCF | ||||||||||
| SUM PV UFCF | -1,633.0 | |||||||||
| Long Term Growth Rate, % | 2.00 | |||||||||
| Free cash flow (T + 1) | -900 | |||||||||
| Terminal Value | -11,184 | |||||||||
| Present Terminal Value | -6,931 | |||||||||
| Enterprise Value | -8,564 | |||||||||
| Net Debt | 43 | |||||||||
| Equity Value | -8,607 | |||||||||
| Diluted Shares Outstanding, MM | 62 | |||||||||
| Equity Value Per Share | -138.78 |
What You Will Get
- Editable Excel Template: A fully customizable Excel-based DCF Calculator featuring pre-filled real EOLS financials.
- Real-World Data: Historical data and forward-looking estimates (as highlighted in the yellow cells).
- Forecast Flexibility: Adjust forecast assumptions such as revenue growth, EBITDA %, and WACC.
- Automatic Calculations: Instantly observe the impact of your inputs on Evolus, Inc.'s valuation.
- Professional Tool: Designed for investors, CFOs, consultants, and financial analysts.
- User-Friendly Design: Organized for clarity and ease of use, complete with step-by-step instructions.
Key Features
- Comprehensive DCF Calculator: Features detailed unlevered and levered DCF valuation models tailored for Evolus, Inc. (EOLS).
- WACC Calculator: Pre-configured Weighted Average Cost of Capital sheet with adjustable inputs specific to Evolus, Inc. (EOLS).
- Customizable Forecast Assumptions: Adjust growth rates, capital expenditures, and discount rates as per the needs of Evolus, Inc. (EOLS).
- Integrated Financial Ratios: Evaluate profitability, leverage, and efficiency ratios relevant to Evolus, Inc. (EOLS).
- Visual Dashboard and Charts: Graphical representations that summarize essential valuation metrics for straightforward analysis of Evolus, Inc. (EOLS).
How It Works
- 1. Access the Template: Download and open the Excel file containing Evolus, Inc.'s (EOLS) financial data.
- 2. Adjust Key Inputs: Modify essential parameters such as growth projections, WACC, and capital expenditures.
- 3. See Results in Real-Time: The DCF model automatically computes intrinsic value and NPV based on your inputs.
- 4. Explore Different Scenarios: Evaluate various forecasts to understand potential valuation variations.
- 5. Present with Assurance: Deliver expert valuation analysis to back your strategic decisions.
Why Choose Evolus, Inc. (EOLS) Calculator?
- Save Time: Skip the hassle of building a DCF model from the ground up – it's ready for immediate use.
- Enhance Accuracy: Dependable financial data and formulas minimize valuation errors.
- Completely Customizable: Adjust the model to align with your specific assumptions and forecasts.
- User-Friendly: Intuitive charts and outputs simplify result analysis.
- Endorsed by Professionals: Crafted for experts who prioritize accuracy and functionality.
Who Should Use This Product?
- Investors: Accurately estimate Evolus, Inc.'s (EOLS) fair value before making investment decisions.
- CFOs: Leverage a professional-grade DCF model for financial reporting and analysis related to Evolus, Inc. (EOLS).
- Consultants: Quickly adapt the template for valuation reports tailored to Evolus, Inc. (EOLS) for clients.
- Entrepreneurs: Gain insights into financial modeling techniques employed by leading companies like Evolus, Inc. (EOLS).
- Educators: Use it as a teaching tool to demonstrate valuation methodologies relevant to Evolus, Inc. (EOLS).
What the Template Contains
- Pre-Filled DCF Model: Evolus, Inc.’s (EOLS) financial data preloaded for immediate use.
- WACC Calculator: Detailed calculations for Weighted Average Cost of Capital.
- Financial Ratios: Evaluate Evolus, Inc.’s (EOLS) profitability, leverage, and efficiency.
- Editable Inputs: Change assumptions such as growth, margins, and CAPEX to fit your scenarios.
- Financial Statements: Annual and quarterly reports to support detailed analysis.
- Interactive Dashboard: Easily visualize key valuation metrics and results.
Disclaimer
All information, articles, and product details provided on this website are for general informational and educational purposes only. We do not claim any ownership over, nor do we intend to infringe upon, any trademarks, copyrights, logos, brand names, or other intellectual property mentioned or depicted on this site. Such intellectual property remains the property of its respective owners, and any references here are made solely for identification or informational purposes, without implying any affiliation, endorsement, or partnership.
We make no representations or warranties, express or implied, regarding the accuracy, completeness, or suitability of any content or products presented. Nothing on this website should be construed as legal, tax, investment, financial, medical, or other professional advice. In addition, no part of this site—including articles or product references—constitutes a solicitation, recommendation, endorsement, advertisement, or offer to buy or sell any securities, franchises, or other financial instruments, particularly in jurisdictions where such activity would be unlawful.
All content is of a general nature and may not address the specific circumstances of any individual or entity. It is not a substitute for professional advice or services. Any actions you take based on the information provided here are strictly at your own risk. You accept full responsibility for any decisions or outcomes arising from your use of this website and agree to release us from any liability in connection with your use of, or reliance upon, the content or products found herein.