|
Equinix, Inc. (EQIX) DCF -Bewertung |
Fully Editable: Tailor To Your Needs In Excel Or Sheets
Professional Design: Trusted, Industry-Standard Templates
Investor-Approved Valuation Models
MAC/PC Compatible, Fully Unlocked
No Expertise Is Needed; Easy To Follow
Equinix, Inc. (EQIX) Bundle
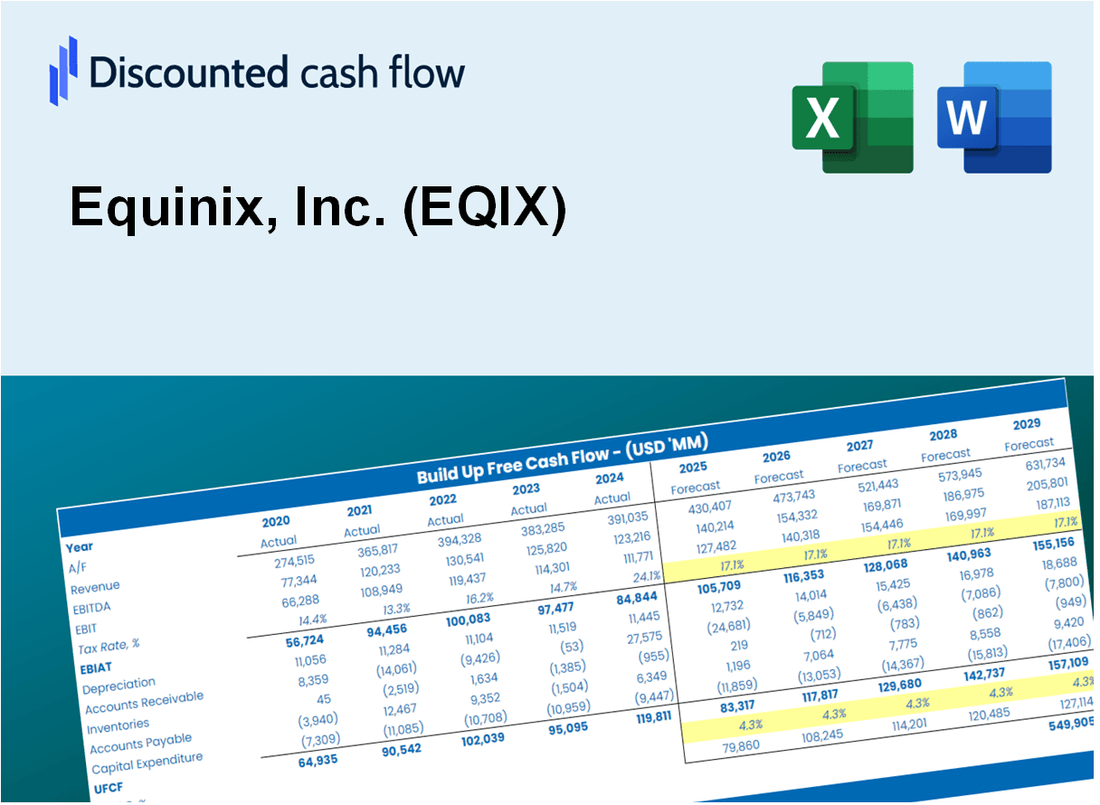
Unser DCF-Taschenrechner von Equinix, Inc. (EQIX) für Genauigkeit ermöglicht es Ihnen, die Bewertung von Equinix mithilfe realer Finanzdaten zu bewerten und gleichzeitig vollständige Flexibilität zu bieten, um alle Schlüsselparameter für erweiterte Projektionen zu ändern.
What You Will Get
- Real Equinix Data: Preloaded financials – from revenue to EBIT – based on actual and projected figures.
- Full Customization: Adjust all critical parameters (yellow cells) like WACC, growth %, and tax rates.
- Instant Valuation Updates: Automatic recalculations to analyze the impact of changes on Equinix’s fair value.
- Versatile Excel Template: Tailored for quick edits, scenario testing, and detailed projections.
- Time-Saving and Accurate: Skip building models from scratch while maintaining precision and flexibility.
Key Features
- Comprehensive DCF Calculator: Features detailed unlevered and levered DCF valuation models tailored for Equinix, Inc. (EQIX).
- WACC Calculator: Pre-configured Weighted Average Cost of Capital sheet with adjustable inputs for precise calculations.
- Customizable Forecast Assumptions: Easily modify growth rates, capital expenditures, and discount rates to fit your analysis.
- Integrated Financial Ratios: Evaluate profitability, leverage, and efficiency ratios specific to Equinix, Inc. (EQIX).
- Interactive Dashboard and Charts: Visual representations provide a summary of key valuation metrics for straightforward analysis.
How It Works
- Download the Template: Gain immediate access to the Excel-based EQIX DCF Calculator.
- Input Your Assumptions: Modify the yellow-highlighted cells for growth rates, WACC, margins, and other variables.
- Instant Calculations: The model automatically refreshes Equinix’s intrinsic value.
- Test Scenarios: Experiment with various assumptions to assess potential valuation shifts.
- Analyze and Decide: Leverage the results to inform your investment or financial strategy.
Why Choose This Calculator for Equinix, Inc. (EQIX)?
- Accurate Data: Up-to-date Equinix financials provide dependable valuation outcomes.
- Customizable: Tailor essential parameters such as growth rates, WACC, and tax rates to fit your forecasts.
- Time-Saving: Built-in calculations save you the hassle of starting from the ground up.
- Professional-Grade Tool: Crafted for investors, analysts, and consultants in the field.
- User-Friendly: Clear design and step-by-step guidance ensure accessibility for all users.
Who Should Use This Product?
- Professional Investors: Develop comprehensive and trustworthy valuation models for analyzing Equinix, Inc. (EQIX) investments.
- Corporate Finance Teams: Evaluate valuation scenarios to inform strategic decisions within their organizations.
- Consultants and Advisors: Deliver precise valuation insights to clients interested in Equinix, Inc. (EQIX) stock.
- Students and Educators: Utilize real-time data to enhance learning and practice in financial modeling.
- Tech Enthusiasts: Gain insight into how companies like Equinix, Inc. (EQIX) are assessed within the technology sector.
What the Template Contains
- Pre-Filled Data: Features Equinix’s historical financials and projections.
- Discounted Cash Flow Model: Customizable DCF valuation model with automatic calculations.
- Weighted Average Cost of Capital (WACC): A specific sheet for calculating WACC using tailored inputs.
- Key Financial Ratios: Evaluate Equinix’s profitability, efficiency, and financial leverage.
- Customizable Inputs: Easily adjust revenue growth, profit margins, and tax rates.
- Clear Dashboard: Visuals and tables summarizing essential valuation outcomes.
Disclaimer
All information, articles, and product details provided on this website are for general informational and educational purposes only. We do not claim any ownership over, nor do we intend to infringe upon, any trademarks, copyrights, logos, brand names, or other intellectual property mentioned or depicted on this site. Such intellectual property remains the property of its respective owners, and any references here are made solely for identification or informational purposes, without implying any affiliation, endorsement, or partnership.
We make no representations or warranties, express or implied, regarding the accuracy, completeness, or suitability of any content or products presented. Nothing on this website should be construed as legal, tax, investment, financial, medical, or other professional advice. In addition, no part of this site—including articles or product references—constitutes a solicitation, recommendation, endorsement, advertisement, or offer to buy or sell any securities, franchises, or other financial instruments, particularly in jurisdictions where such activity would be unlawful.
All content is of a general nature and may not address the specific circumstances of any individual or entity. It is not a substitute for professional advice or services. Any actions you take based on the information provided here are strictly at your own risk. You accept full responsibility for any decisions or outcomes arising from your use of this website and agree to release us from any liability in connection with your use of, or reliance upon, the content or products found herein.