
|
ENstar Group Limited (ESGR) DCF -Bewertung |
Fully Editable: Tailor To Your Needs In Excel Or Sheets
Professional Design: Trusted, Industry-Standard Templates
Investor-Approved Valuation Models
MAC/PC Compatible, Fully Unlocked
No Expertise Is Needed; Easy To Follow
Enstar Group Limited (ESGR) Bundle
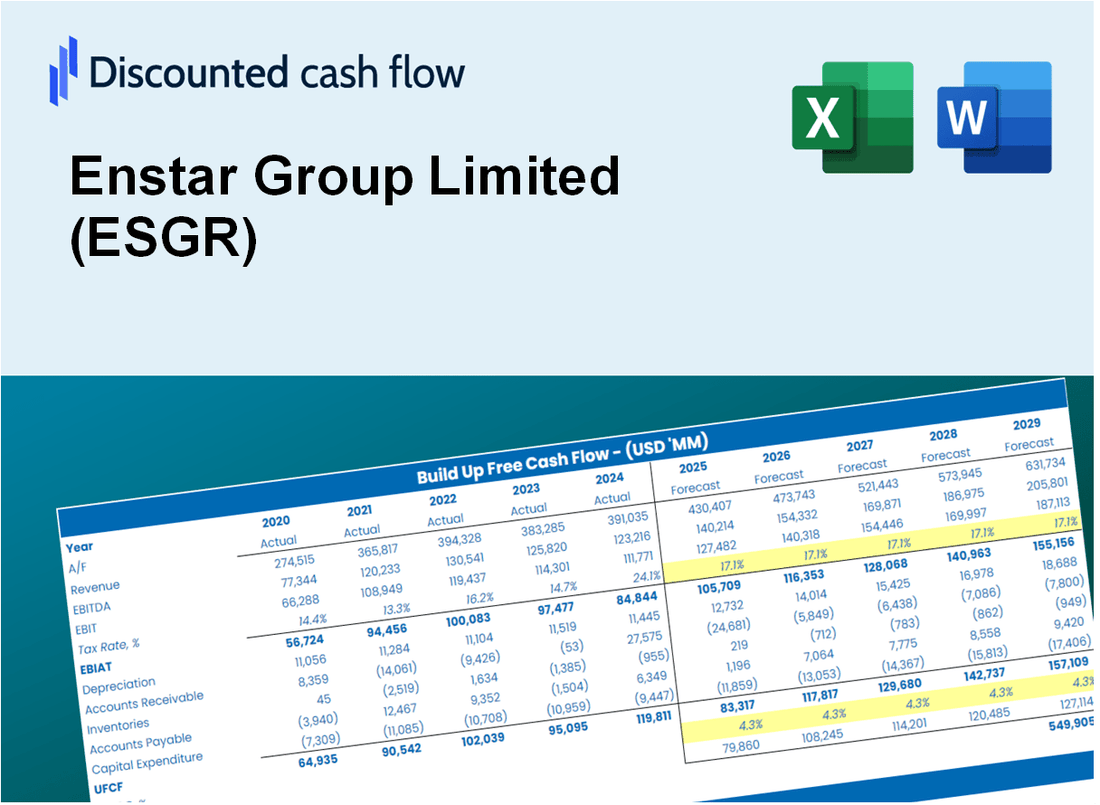
Unabhängig davon, ob Sie ein Investor oder Analyst sind, dient dieser DCF -Taschenrechner für Enstar Group Limited (ESGR) als wesentliches Werkzeug für eine genaue Bewertung. Mit echten Daten von Enstar Group Limited vorinstalliert, können Sie Prognosen anpassen und die Auswirkungen sofort beobachten.
What You Will Receive
- Adjustable Forecast Parameters: Effortlessly modify assumptions (growth %, margins, WACC) to explore various scenarios.
- Comprehensive Data: Enstar Group Limited's (ESGR) financial information pre-loaded to enhance your analysis.
- Instant DCF Calculations: The template automatically computes Net Present Value (NPV) and intrinsic value for you.
- Tailored and Professional: A sleek Excel model that can be customized to fit your valuation requirements.
- Designed for Analysts and Investors: Perfect for testing forecasts, confirming strategies, and increasing efficiency.
Key Features
- Comprehensive Financial Data: Gain access to precise pre-loaded historical figures and future forecasts for Enstar Group Limited (ESGR).
- Tailorable Forecast Parameters: Modify highlighted cells for key metrics such as WACC, growth rates, and profit margins.
- Real-time Calculations: Instant updates for DCF, Net Present Value (NPV), and cash flow assessments.
- Interactive Dashboard: User-friendly charts and summaries to clearly present your valuation findings.
- Designed for All Skill Levels: An intuitive layout suitable for investors, CFOs, and consultants alike.
How It Works
- Download the Template: Gain immediate access to the Excel-based ESGR DCF Calculator.
- Input Your Assumptions: Modify the yellow-highlighted cells for growth rates, WACC, margins, and other variables.
- Instant Calculations: The model automatically recalculates Enstar Group’s intrinsic value.
- Test Scenarios: Experiment with different assumptions to assess potential valuation variations.
- Analyze and Decide: Utilize the outcomes to inform your investment or financial analysis.
Why Choose This Calculator for Enstar Group Limited (ESGR)?
- Accuracy: Leverage real Enstar financials for precise data.
- Flexibility: Allows users to experiment and adjust inputs at will.
- Time-Saving: Avoid the complexities of constructing a DCF model from the ground up.
- Professional-Grade: Crafted with the expertise and usability expected at the CFO level.
- User-Friendly: Intuitive design makes it accessible for individuals without extensive financial modeling skills.
Who Should Use This Product?
- Finance Students: Explore valuation methodologies and apply them using real-time data for Enstar Group Limited (ESGR).
- Academics: Integrate advanced financial models into your research or teaching materials related to Enstar Group Limited (ESGR).
- Investors: Validate your investment hypotheses and evaluate valuation scenarios for Enstar Group Limited (ESGR).
- Analysts: Enhance your analysis process with a ready-to-use, adaptable DCF model tailored for Enstar Group Limited (ESGR).
- Small Business Owners: Understand the valuation techniques used for large public companies like Enstar Group Limited (ESGR).
What the Template Contains
- Comprehensive DCF Model: Editable template featuring detailed valuation calculations tailored for Enstar Group Limited (ESGR).
- Real-World Data: Enstar’s historical and projected financials preloaded for in-depth analysis.
- Customizable Parameters: Adjust WACC, growth rates, and tax assumptions to explore various scenarios.
- Financial Statements: Complete annual and quarterly breakdowns for enhanced insights.
- Key Ratios: Integrated analysis for profitability, efficiency, and leverage metrics.
- Dashboard with Visual Outputs: Charts and tables designed for clear, actionable results.
Disclaimer
All information, articles, and product details provided on this website are for general informational and educational purposes only. We do not claim any ownership over, nor do we intend to infringe upon, any trademarks, copyrights, logos, brand names, or other intellectual property mentioned or depicted on this site. Such intellectual property remains the property of its respective owners, and any references here are made solely for identification or informational purposes, without implying any affiliation, endorsement, or partnership.
We make no representations or warranties, express or implied, regarding the accuracy, completeness, or suitability of any content or products presented. Nothing on this website should be construed as legal, tax, investment, financial, medical, or other professional advice. In addition, no part of this site—including articles or product references—constitutes a solicitation, recommendation, endorsement, advertisement, or offer to buy or sell any securities, franchises, or other financial instruments, particularly in jurisdictions where such activity would be unlawful.
All content is of a general nature and may not address the specific circumstances of any individual or entity. It is not a substitute for professional advice or services. Any actions you take based on the information provided here are strictly at your own risk. You accept full responsibility for any decisions or outcomes arising from your use of this website and agree to release us from any liability in connection with your use of, or reliance upon, the content or products found herein.