
|
Evolv Technologies Holdings, Inc. (EVLV) DCF -Bewertung |
Fully Editable: Tailor To Your Needs In Excel Or Sheets
Professional Design: Trusted, Industry-Standard Templates
Investor-Approved Valuation Models
MAC/PC Compatible, Fully Unlocked
No Expertise Is Needed; Easy To Follow
Evolv Technologies Holdings, Inc. (EVLV) Bundle
Verbessern Sie Ihre Anlagestrategien mit dem (EVLV) DCF -Taschenrechner! Erforschen Sie reale Finanzdaten aus EVOLV -Technologien, passen Sie Wachstumsprojektionen und -kosten an und beobachten Sie sofort, wie sich diese Veränderungen auf den inneren Wert von (EVLV) auswirken.
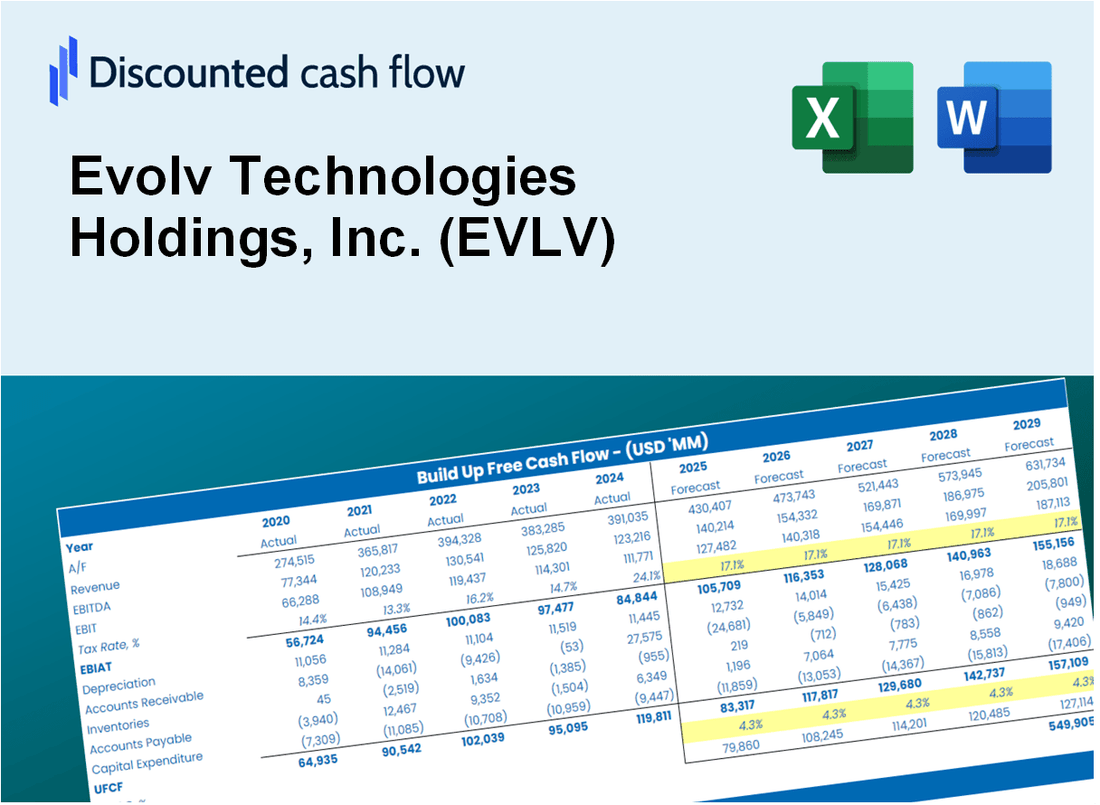
Discounted Cash Flow (DCF) - (USD MM)
| Year | AY1 2020 |
AY2 2021 |
AY3 2022 |
AY4 2023 |
AY5 2024 |
FY1 2025 |
FY2 2026 |
FY3 2027 |
FY4 2028 |
FY5 2029 |
|---|---|---|---|---|---|---|---|---|---|---|
| Revenue | 4.8 | 23.4 | 52.7 | 80.4 | 103.9 | 177.0 | 301.7 | 514.1 | 876.2 | 1,493.2 |
| Revenue Growth, % | 0 | 388.88 | 125.36 | 52.54 | 29.16 | 70.42 | 70.42 | 70.42 | 70.42 | 70.42 |
| EBITDA | -25.9 | -1.9 | -80.6 | -95.6 | -36.6 | -121.6 | -207.3 | -353.2 | -602.0 | -1,025.9 |
| EBITDA, % | -541.21 | -8.23 | -152.96 | -118.9 | -35.28 | -68.7 | -68.7 | -68.7 | -68.7 | -68.7 |
| Depreciation | 1.1 | 2.9 | 5.4 | 9.9 | 17.4 | 26.2 | 44.7 | 76.1 | 129.7 | 221.1 |
| Depreciation, % | 22.26 | 12.38 | 10.32 | 12.35 | 16.73 | 14.81 | 14.81 | 14.81 | 14.81 | 14.81 |
| EBIT | -27.0 | -4.8 | -86.1 | -105.5 | -54.0 | -131.9 | -224.8 | -383.1 | -653.0 | -1,112.8 |
| EBIT, % | -563.47 | -20.6 | -163.29 | -131.25 | -52.01 | -74.52 | -74.52 | -74.52 | -74.52 | -74.52 |
| Total Cash | 4.7 | 307.7 | 230.1 | 118.8 | 51.9 | 158.7 | 270.5 | 461.0 | 785.6 | 1,338.9 |
| Total Cash, percent | .0 | .0 | .0 | .0 | .0 | .0 | .0 | .0 | .0 | .0 |
| Account Receivables | 1.4 | 7.9 | 34.8 | 26.3 | 29.2 | 67.3 | 114.6 | 195.4 | 332.9 | 567.4 |
| Account Receivables, % | 29.28 | 33.92 | 65.96 | 32.73 | 28.1 | 38 | 38 | 38 | 38 | 38 |
| Inventories | 2.7 | 2.9 | 10.3 | 9.5 | 17.0 | 41.5 | 70.8 | 120.6 | 205.5 | 350.2 |
| Inventories, % | 57.3 | 12.35 | 19.46 | 11.82 | 16.33 | 23.45 | 23.45 | 23.45 | 23.45 | 23.45 |
| Accounts Payable | 4.4 | 6.0 | 18.2 | 17.4 | 10.5 | 65.4 | 111.5 | 190.0 | 323.9 | 552.0 |
| Accounts Payable, % | 92.73 | 25.84 | 34.51 | 21.64 | 10.1 | 36.96 | 36.96 | 36.96 | 36.96 | 36.96 |
| Capital Expenditure | -6.6 | -17.6 | -24.2 | -72.7 | -37.3 | -123.0 | -209.6 | -357.1 | -608.6 | -1,037.3 |
| Capital Expenditure, % | -138.12 | -75.17 | -45.87 | -90.36 | -35.93 | -69.47 | -69.47 | -69.47 | -69.47 | -69.47 |
| Tax Rate, % | 0 | 0 | 0 | 0 | 0 | 0 | 0 | 0 | 0 | 0 |
| EBITAT | -27.0 | -4.8 | -86.1 | -105.6 | -54.0 | -131.9 | -224.8 | -383.1 | -653.0 | -1,112.8 |
| Depreciation | ||||||||||
| Changes in Account Receivables | ||||||||||
| Changes in Inventories | ||||||||||
| Changes in Accounts Payable | ||||||||||
| Capital Expenditure | ||||||||||
| UFCF | -32.2 | -24.6 | -126.9 | -159.9 | -91.2 | -236.3 | -420.2 | -716.2 | -1,220.5 | -2,080.1 |
| WACC, % | 12.16 | 12.16 | 12.16 | 12.16 | 12.16 | 12.16 | 12.16 | 12.16 | 12.16 | 12.16 |
| PV UFCF | ||||||||||
| SUM PV UFCF | -2,995.8 | |||||||||
| Long Term Growth Rate, % | 2.00 | |||||||||
| Free cash flow (T + 1) | -2,122 | |||||||||
| Terminal Value | -20,888 | |||||||||
| Present Terminal Value | -11,770 | |||||||||
| Enterprise Value | -14,765 | |||||||||
| Net Debt | -11 | |||||||||
| Equity Value | -14,754 | |||||||||
| Diluted Shares Outstanding, MM | 157 | |||||||||
| Equity Value Per Share | -94.23 |
What You Will Get
- Pre-Filled Financial Model: Evolv Technologies' actual data enables precise DCF valuation.
- Full Forecast Control: Adjust revenue growth, margins, WACC, and other key drivers.
- Instant Calculations: Automatic updates ensure you see results as you make changes.
- Investor-Ready Template: A refined Excel file designed for professional-grade valuation.
- Customizable and Reusable: Tailored for flexibility, allowing repeated use for detailed forecasts.
Key Features
- Comprehensive EVLV Data: Pre-filled with Evolv Technologies' historical performance metrics and future growth forecasts.
- Customizable Assumptions: Modify parameters such as revenue growth rates, profit margins, discount rates, tax assumptions, and capital investment plans.
- Interactive Valuation Model: Automatic recalculations of Net Present Value (NPV) and intrinsic value based on your customized inputs.
- Scenario Analysis: Develop various forecasting scenarios to evaluate different potential valuation results.
- Intuitive Interface: Designed for ease of use, making it accessible for both industry experts and novices.
How It Works
- 1. Access the Template: Download and open the Excel file containing Evolv Technologies' preloaded data.
- 2. Modify Assumptions: Adjust key parameters such as growth rates, WACC, and capital expenditures.
- 3. Analyze Results Instantly: The DCF model automatically calculates intrinsic value and NPV.
- 4. Explore Scenarios: Evaluate various forecasts to assess different valuation outcomes.
- 5. Present with Confidence: Deliver professional valuation insights to inform your strategic decisions.
Why Choose This Calculator for Evolv Technologies Holdings, Inc. (EVLV)?
- User-Friendly Interface: Tailored for both novices and seasoned users.
- Customizable Inputs: Adjust parameters effortlessly to suit your financial analysis.
- Real-Time Valuation Updates: Instantly view changes to Evolv's valuation as you modify inputs.
- Pre-Loaded Financials: Comes with Evolv’s actual financial data for immediate evaluation.
- Preferred by Experts: Utilized by investors and analysts for making well-informed choices.
Who Should Use Evolv Technologies Holdings, Inc. (EVLV)?
- Investors: Gain insights and make informed decisions with cutting-edge technology solutions.
- Security Professionals: Enhance your security measures using Evolv's innovative detection systems.
- Consultants: Tailor Evolv's offerings for client engagements and strategic recommendations.
- Technology Enthusiasts: Explore the latest advancements in security technology and its applications.
- Educators and Students: Utilize Evolv's resources as a case study in technology and security courses.
What the Template Contains
- Operating and Balance Sheet Data: Pre-filled Evolv Technologies Holdings, Inc. (EVLV) historical data and forecasts, including revenue, EBITDA, EBIT, and capital expenditures.
- WACC Calculation: A dedicated sheet for Weighted Average Cost of Capital (WACC), including parameters like Beta, risk-free rate, and share price.
- DCF Valuation (Unlevered and Levered): Editable Discounted Cash Flow models showing intrinsic value with detailed calculations.
- Financial Statements: Pre-loaded financial statements (annual and quarterly) to support analysis.
- Key Ratios: Includes profitability, leverage, and efficiency ratios for Evolv Technologies Holdings, Inc. (EVLV).
- Dashboard and Charts: Visual summary of valuation outputs and assumptions to analyze results easily.
Disclaimer
All information, articles, and product details provided on this website are for general informational and educational purposes only. We do not claim any ownership over, nor do we intend to infringe upon, any trademarks, copyrights, logos, brand names, or other intellectual property mentioned or depicted on this site. Such intellectual property remains the property of its respective owners, and any references here are made solely for identification or informational purposes, without implying any affiliation, endorsement, or partnership.
We make no representations or warranties, express or implied, regarding the accuracy, completeness, or suitability of any content or products presented. Nothing on this website should be construed as legal, tax, investment, financial, medical, or other professional advice. In addition, no part of this site—including articles or product references—constitutes a solicitation, recommendation, endorsement, advertisement, or offer to buy or sell any securities, franchises, or other financial instruments, particularly in jurisdictions where such activity would be unlawful.
All content is of a general nature and may not address the specific circumstances of any individual or entity. It is not a substitute for professional advice or services. Any actions you take based on the information provided here are strictly at your own risk. You accept full responsibility for any decisions or outcomes arising from your use of this website and agree to release us from any liability in connection with your use of, or reliance upon, the content or products found herein.