
|
Everi Holdings Inc. (EVRI) DCF -Bewertung |
Fully Editable: Tailor To Your Needs In Excel Or Sheets
Professional Design: Trusted, Industry-Standard Templates
Investor-Approved Valuation Models
MAC/PC Compatible, Fully Unlocked
No Expertise Is Needed; Easy To Follow
Everi Holdings Inc. (EVRI) Bundle
Meister Sie Ihre Everi Holdings Inc. (EVRI) -Schanganalyse mit unserem ausgefeilten DCF -Taschenrechner! Diese Excel -Vorlage mit authentischen (EVRI) -Daten (EVRI) -Daten, ermöglicht es Ihnen, Vorhersagen und Annahmen für eine genaue Berechnung des inneren Wertes von Everi Holdings Inc. anzupassen.
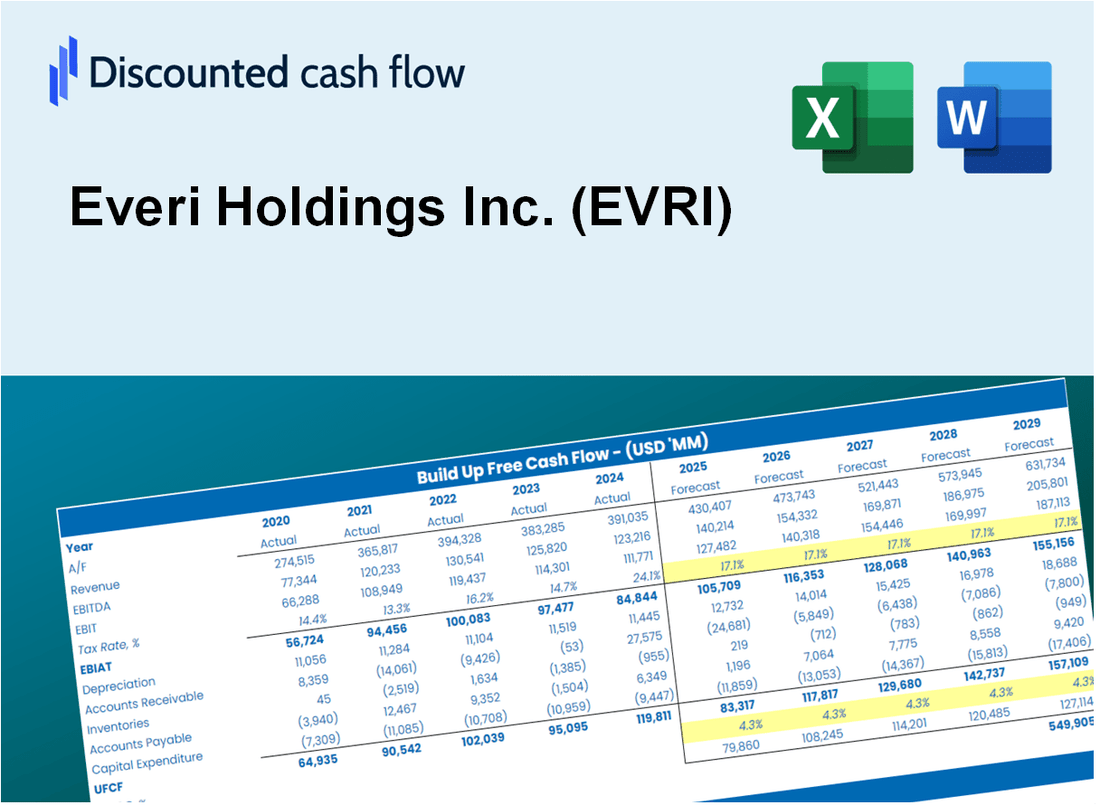
Discounted Cash Flow (DCF) - (USD MM)
| Year | AY1 2020 |
AY2 2021 |
AY3 2022 |
AY4 2023 |
AY5 2024 |
FY1 2025 |
FY2 2026 |
FY3 2027 |
FY4 2028 |
FY5 2029 |
|---|---|---|---|---|---|---|---|---|---|---|
| Revenue | 383,7 | 660,4 | 782,5 | 807,8 | 757,9 | 924,0 | 1 126,5 | 1 373,4 | 1 674,5 | 2 041,5 |
| Revenue Growth, % | 0 | 72.12 | 18.49 | 3.23 | -6.18 | 21.92 | 21.92 | 21.92 | 21.92 | 21.92 |
| EBITDA | 137,3 | 197,5 | 213,4 | 318,0 | 243,1 | 303,9 | 370,4 | 451,6 | 550,6 | 671,3 |
| EBITDA, % | 35.8 | 29.91 | 27.26 | 39.37 | 32.08 | 32.88 | 32.88 | 32.88 | 32.88 | 32.88 |
| Depreciation | 155,3 | 133,2 | 140,8 | 138,7 | 154,0 | 214,6 | 261,6 | 319,0 | 388,9 | 474,1 |
| Depreciation, % | 40.48 | 20.17 | 17.99 | 17.17 | 20.31 | 23.23 | 23.23 | 23.23 | 23.23 | 23.23 |
| EBIT | -18,0 | 64,3 | 72,6 | 179,3 | 89,2 | 89,2 | 108,8 | 132,6 | 161,7 | 197,2 |
| EBIT, % | -4.68 | 9.74 | 9.27 | 22.19 | 11.77 | 9.66 | 9.66 | 9.66 | 9.66 | 9.66 |
| Total Cash | 251,7 | 302,0 | 293,4 | 272,4 | 400,7 | 435,1 | 530,4 | 646,7 | 788,4 | 961,2 |
| Total Cash, percent | 65.6 | 45.73 | 37.49 | 33.72 | 52.87 | 47.08 | 47.08 | 47.08 | 47.08 | 47.08 |
| Account Receivables | 134,8 | 194,1 | 382,6 | 549,8 | 214,5 | 387,7 | 472,7 | 576,3 | 702,6 | 856,6 |
| Account Receivables, % | 35.15 | 29.39 | 48.9 | 68.06 | 28.3 | 41.96 | 41.96 | 41.96 | 41.96 | 41.96 |
| Inventories | 27,7 | 29,2 | 58,4 | 70,6 | 67,8 | 68,0 | 82,9 | 101,1 | 123,3 | 150,3 |
| Inventories, % | 7.23 | 4.43 | 7.46 | 8.74 | 8.95 | 7.36 | 7.36 | 7.36 | 7.36 | 7.36 |
| Accounts Payable | 227,7 | 25,5 | 29,6 | 30,3 | 13,9 | 134,1 | 163,5 | 199,4 | 243,1 | 296,3 |
| Accounts Payable, % | 59.36 | 3.85 | 3.79 | 3.75 | 1.83 | 14.52 | 14.52 | 14.52 | 14.52 | 14.52 |
| Capital Expenditure | -76,4 | -104,7 | -127,6 | -145,1 | -156,4 | -167,6 | -204,3 | -249,1 | -303,7 | -370,2 |
| Capital Expenditure, % | -19.92 | -15.86 | -16.3 | -17.96 | -20.64 | -18.14 | -18.14 | -18.14 | -18.14 | -18.14 |
| Tax Rate, % | 5.54 | 5.54 | 5.54 | 5.54 | 5.54 | 5.54 | 5.54 | 5.54 | 5.54 | 5.54 |
| EBITAT | -16,8 | 97,4 | 55,5 | 148,2 | 84,2 | 79,8 | 97,3 | 118,6 | 144,6 | 176,3 |
| Depreciation | ||||||||||
| Changes in Account Receivables | ||||||||||
| Changes in Inventories | ||||||||||
| Changes in Accounts Payable | ||||||||||
| Capital Expenditure | ||||||||||
| UFCF | 127,3 | -137,2 | -144,8 | -36,9 | 403,5 | 73,6 | 84,1 | 102,6 | 125,0 | 152,4 |
| WACC, % | 8.58 | 8.8 | 8.02 | 8.22 | 8.61 | 8.44 | 8.44 | 8.44 | 8.44 | 8.44 |
| PV UFCF | ||||||||||
| SUM PV UFCF | ,0 | ,0 | ,0 | ,0 | ,0 | ,0 | ,0 | ,0 | ,0 | 411,9 |
| Long Term Growth Rate, % | 0.50 | |||||||||
| Free cash flow (T + 1) | 153 | |||||||||
| Terminal Value | 1,929 | |||||||||
| Present Terminal Value | 1,286 | |||||||||
| Enterprise Value | 1,698 | |||||||||
| Net Debt | 558 | |||||||||
| Equity Value | 1,140 | |||||||||
| Diluted Shares Outstanding, MM | 88 | |||||||||
| Equity Value Per Share | 12.93 |
What You Will Get
- Real EVRI Financial Data: Pre-filled with Everi Holdings Inc.'s historical and projected data for precise analysis.
- Fully Editable Template: Modify key inputs like revenue growth, WACC, and EBITDA % with ease.
- Automatic Calculations: See Everi Holdings Inc.'s intrinsic value update instantly based on your changes.
- Professional Valuation Tool: Designed for investors, analysts, and consultants seeking accurate DCF results.
- User-Friendly Design: Simple structure and clear instructions for all experience levels.
Key Features
- Comprehensive EVRI Data: Pre-filled with Everi Holdings' historical financials and future projections.
- Fully Customizable Inputs: Modify revenue growth, profit margins, WACC, tax rates, and capital expenditures.
- Dynamic Valuation Model: Instant updates to Net Present Value (NPV) and intrinsic value based on your adjustments.
- Scenario Testing: Develop various forecast scenarios to evaluate different valuation results.
- User-Friendly Design: Intuitive, organized, and crafted for both professionals and newcomers.
How It Works
- Step 1: Download the prebuilt Excel template featuring Everi Holdings Inc. (EVRI) data.
- Step 2: Navigate through the pre-filled sheets to familiarize yourself with the essential metrics.
- Step 3: Adjust forecasts and assumptions in the editable yellow cells (WACC, growth, margins).
- Step 4: Instantly see the recalculated results, including Everi Holdings Inc.'s (EVRI) intrinsic value.
- Step 5: Make well-informed investment decisions or create reports using the generated outputs.
Why Choose This Calculator for Everi Holdings Inc. (EVRI)?
- All-in-One Solution: Features DCF, WACC, and financial ratio assessments tailored for Everi Holdings Inc. (EVRI).
- Flexible Inputs: Modify yellow-highlighted cells to explore different financial scenarios.
- In-Depth Analysis: Automatically computes Everi Holdings Inc. (EVRI)'s intrinsic value and Net Present Value.
- Preloaded Information: Historical and projected data provide reliable starting figures for analysis.
- High-Quality Standards: Perfect for financial analysts, investors, and business consultants focusing on Everi Holdings Inc. (EVRI).
Who Should Use This Product?
- Individual Investors: Make informed decisions about buying or selling Everi Holdings Inc. (EVRI) stock.
- Financial Analysts: Streamline valuation processes with ready-to-use financial models for Everi Holdings Inc. (EVRI).
- Consultants: Deliver professional valuation insights on Everi Holdings Inc. (EVRI) to clients quickly and accurately.
- Business Owners: Understand how companies like Everi Holdings Inc. (EVRI) are valued to guide your own strategy.
- Finance Students: Learn valuation techniques using real-world data and scenarios related to Everi Holdings Inc. (EVRI).
What the Everi Holdings Inc. (EVRI) Template Contains
- Comprehensive DCF Model: Editable template featuring detailed valuation calculations tailored for Everi Holdings Inc.
- Real-World Data: Everi’s historical and projected financials preloaded for in-depth analysis.
- Customizable Parameters: Modify WACC, growth rates, and tax assumptions to explore various scenarios.
- Financial Statements: Complete annual and quarterly breakdowns for enhanced insights into Everi's performance.
- Key Ratios: Integrated analysis for profitability, efficiency, and leverage specific to Everi Holdings Inc.
- Dashboard with Visual Outputs: Charts and tables designed for clear, actionable results regarding Everi's financial health.
Disclaimer
All information, articles, and product details provided on this website are for general informational and educational purposes only. We do not claim any ownership over, nor do we intend to infringe upon, any trademarks, copyrights, logos, brand names, or other intellectual property mentioned or depicted on this site. Such intellectual property remains the property of its respective owners, and any references here are made solely for identification or informational purposes, without implying any affiliation, endorsement, or partnership.
We make no representations or warranties, express or implied, regarding the accuracy, completeness, or suitability of any content or products presented. Nothing on this website should be construed as legal, tax, investment, financial, medical, or other professional advice. In addition, no part of this site—including articles or product references—constitutes a solicitation, recommendation, endorsement, advertisement, or offer to buy or sell any securities, franchises, or other financial instruments, particularly in jurisdictions where such activity would be unlawful.
All content is of a general nature and may not address the specific circumstances of any individual or entity. It is not a substitute for professional advice or services. Any actions you take based on the information provided here are strictly at your own risk. You accept full responsibility for any decisions or outcomes arising from your use of this website and agree to release us from any liability in connection with your use of, or reliance upon, the content or products found herein.