
|
Exor N.V. (Exo.as) DCF -Bewertung |
Fully Editable: Tailor To Your Needs In Excel Or Sheets
Professional Design: Trusted, Industry-Standard Templates
Investor-Approved Valuation Models
MAC/PC Compatible, Fully Unlocked
No Expertise Is Needed; Easy To Follow
Exor N.V. (EXO.AS) Bundle
Vereinfachen Sie die Bewertung der Exor N.V. (EXOAs) mit diesem anpassbaren DCF -Taschenrechner! Mit echten EXOR N.V. (EXOAS) -Fonds und einstellbaren Prognoseeingaben können Sie Szenarien testen und Exor N.V. (EXOAs) in Minuten aufdecken.
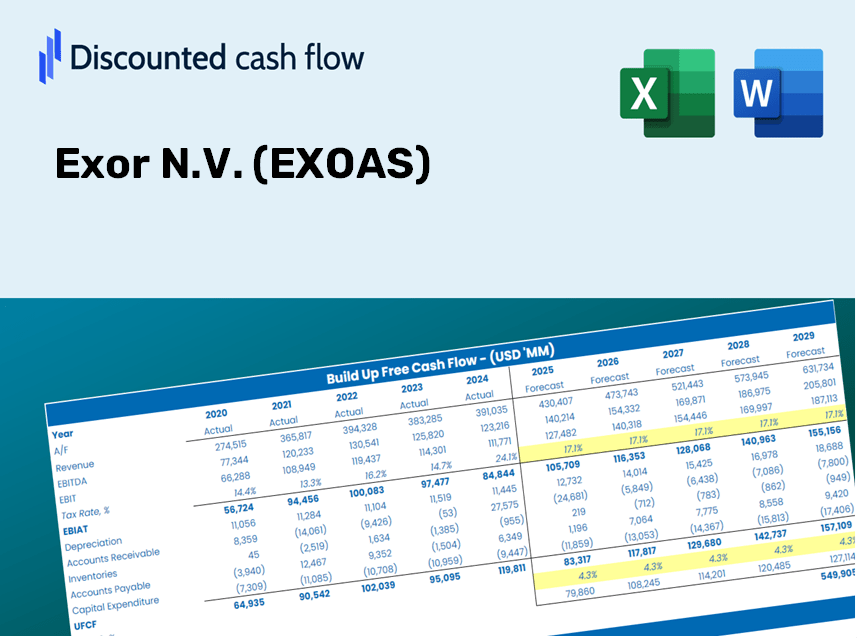
Discounted Cash Flow (DCF) - (USD MM)
| Year | AY1 2020 |
AY2 2021 |
AY3 2022 |
AY4 2023 |
AY5 2024 |
FY1 2025 |
FY2 2026 |
FY3 2027 |
FY4 2028 |
FY5 2029 |
|---|---|---|---|---|---|---|---|---|---|---|
| Revenue | 26,792.0 | 33,617.0 | 41,844.0 | 44,742.0 | 15,395.0 | 15,059.4 | 14,731.2 | 14,410.1 | 14,095.9 | 13,788.7 |
| Revenue Growth, % | 0 | 25.47 | 24.47 | 6.93 | -65.59 | -2.18 | -2.18 | -2.18 | -2.18 | -2.18 |
| EBITDA | 20.9 | 6,550.0 | 5,961.0 | 7,370.0 | 17,387.0 | 4,526.3 | 4,427.6 | 4,331.1 | 4,236.7 | 4,144.3 |
| EBITDA, % | 0.07797104 | 19.48 | 14.25 | 16.47 | 112.94 | 30.06 | 30.06 | 30.06 | 30.06 | 30.06 |
| Depreciation | .2 | 1,728.0 | 1,853.0 | 2,050.0 | 2,050.0 | 827.3 | 809.3 | 791.6 | 774.4 | 757.5 |
| Depreciation, % | 0.000843535384 | 5.14 | 4.43 | 4.58 | 13.32 | 5.49 | 5.49 | 5.49 | 5.49 | 5.49 |
| EBIT | 20.7 | 4,822.0 | 4,108.0 | 5,320.0 | 15,337.0 | 4,088.7 | 3,999.6 | 3,912.4 | 3,827.1 | 3,743.7 |
| EBIT, % | 0.0771275 | 14.34 | 9.82 | 11.89 | 99.62 | 27.15 | 27.15 | 27.15 | 27.15 | 27.15 |
| Total Cash | 35,791.0 | 8,669.0 | 13,510.0 | 8,663.0 | 153.0 | 5,374.1 | 5,257.0 | 5,142.4 | 5,030.3 | 4,920.6 |
| Total Cash, percent | .0 | .0 | .0 | .0 | .0 | .0 | .0 | .0 | .0 | .0 |
| Account Receivables | 20,729.0 | 18,415.0 | 2,070.2 | 29,712.0 | 160.0 | 6,160.6 | 6,026.3 | 5,894.9 | 5,766.5 | 5,640.8 |
| Account Receivables, % | 77.37 | 54.78 | 4.95 | 66.41 | 1.04 | 40.91 | 40.91 | 40.91 | 40.91 | 40.91 |
| Inventories | 14,322.0 | 6,951.0 | 8,032.0 | 8,805.0 | .0 | 3,403.7 | 3,329.5 | 3,256.9 | 3,185.9 | 3,116.5 |
| Inventories, % | 53.46 | 20.68 | 19.2 | 19.68 | 0 | 22.6 | 22.6 | 22.6 | 22.6 | 22.6 |
| Accounts Payable | 26,796.0 | 7,002.0 | 7,843.0 | 7,830.0 | 4.0 | 4,731.6 | 4,628.5 | 4,527.6 | 4,428.9 | 4,332.4 |
| Accounts Payable, % | 100.01 | 20.83 | 18.74 | 17.5 | 0.02598246 | 31.42 | 31.42 | 31.42 | 31.42 | 31.42 |
| Capital Expenditure | -10,253.0 | -1,960.0 | -2,448.0 | -2,810.0 | .0 | -1,693.6 | -1,656.7 | -1,620.6 | -1,585.2 | -1,550.7 |
| Capital Expenditure, % | -38.27 | -5.83 | -5.85 | -6.28 | 0 | -11.25 | -11.25 | -11.25 | -11.25 | -11.25 |
| Tax Rate, % | 0.61645 | 0.61645 | 0.61645 | 0.61645 | 0.61645 | 0.61645 | 0.61645 | 0.61645 | 0.61645 | 0.61645 |
| EBITAT | 2.9 | 1,779.4 | 2,945.1 | 2,834.4 | 15,242.5 | 2,251.0 | 2,202.0 | 2,154.0 | 2,107.0 | 2,061.1 |
| Depreciation | ||||||||||
| Changes in Account Receivables | ||||||||||
| Changes in Inventories | ||||||||||
| Changes in Accounts Payable | ||||||||||
| Capital Expenditure | ||||||||||
| UFCF | -18,504.9 | -8,561.6 | 18,455.0 | -26,353.5 | 47,823.5 | -3,291.9 | 1,459.9 | 1,428.1 | 1,396.9 | 1,366.5 |
| WACC, % | 4.6 | 4.77 | 5.03 | 4.89 | 5.24 | 4.91 | 4.91 | 4.91 | 4.91 | 4.91 |
| PV UFCF | ||||||||||
| SUM PV UFCF | 1,654.0 | |||||||||
| Long Term Growth Rate, % | 2.00 | |||||||||
| Free cash flow (T + 1) | 1,394 | |||||||||
| Terminal Value | 47,924 | |||||||||
| Present Terminal Value | 37,714 | |||||||||
| Enterprise Value | 39,368 | |||||||||
| Net Debt | 3,938 | |||||||||
| Equity Value | 35,430 | |||||||||
| Diluted Shares Outstanding, MM | 221 | |||||||||
| Equity Value Per Share | 160.33 |
What You Will Receive
- Authentic EXOAS Financials: Features both historical and projected data for precise evaluation.
- Customizable Inputs: Adjust WACC, tax rates, revenue growth, and capital expenditures to fit your analysis.
- Dynamic Calculations: Intrinsic value and NPV are computed automatically.
- Scenario Analysis: Explore various scenarios to assess Exor N.V.’s future prospects.
- User-Friendly Design: Designed for professionals while remaining approachable for newcomers.
Key Features
- 🔍 Real-Life EXOR Financials: Pre-filled historical and projected data for Exor N.V. (EXOAS).
- ✏️ Fully Customizable Inputs: Modify all essential parameters (yellow cells) such as WACC, growth %, and tax rates.
- 📊 Professional DCF Valuation: Integrated formulas assess Exor’s intrinsic value utilizing the Discounted Cash Flow method.
- ⚡ Instant Results: Immediately visualize Exor’s valuation upon making adjustments.
- Scenario Analysis: Examine and compare results for different financial assumptions side-by-side.
How It Functions
- Download: Obtain the pre-configured Excel file containing Exor N.V.'s (EXOAS) financial data.
- Customize: Modify projections, such as revenue growth, EBITDA percentage, and WACC.
- Real-Time Updates: Intrinsic value and NPV calculations refresh automatically.
- Scenario Testing: Generate various forecasts and effortlessly compare results.
- Informed Decisions: Leverage the valuation outcomes to shape your investment approach.
Why Opt for Exor N.V. (EXOAS) Calculator?
- Time-Saving: Skip the hassle of building a DCF model from scratch – it’s ready for immediate use.
- Enhanced Accuracy: Dependable financial data and formulas minimize errors in your valuation process.
- Completely Customizable: Adapt the model to align with your specific assumptions and forecasts.
- User-Friendly: Intuitive charts and outputs simplify result analysis.
- Preferred by Professionals: Crafted for experts who prioritize accuracy and ease of use.
Who Can Benefit from This Product?
- Investors: Effectively assess the fair value of Exor N.V. (EXOAS) prior to making investment choices.
- CFOs: Utilize a high-quality DCF model for precise financial reporting and analysis.
- Consultants: Easily customize the template for client valuation reports.
- Entrepreneurs: Discover financial modeling insights applied by Fortune 500 firms.
- Educators: Employ it as an educational resource to illustrate valuation techniques.
Contents of the Template
- Pre-Filled DCF Model: Exor N.V. (EXOAS) financial data preloaded for immediate use.
- WACC Calculator: Comprehensive calculations for Weighted Average Cost of Capital.
- Financial Ratios: Assess Exor N.V. (EXOAS) profitability, leverage, and efficiency metrics.
- Editable Inputs: Modify assumptions like growth rates, profit margins, and CAPEX to align with your scenarios.
- Financial Statements: Annual and quarterly reports to facilitate in-depth analysis.
- Interactive Dashboard: Effortlessly visualize essential valuation metrics and outcomes.
Disclaimer
All information, articles, and product details provided on this website are for general informational and educational purposes only. We do not claim any ownership over, nor do we intend to infringe upon, any trademarks, copyrights, logos, brand names, or other intellectual property mentioned or depicted on this site. Such intellectual property remains the property of its respective owners, and any references here are made solely for identification or informational purposes, without implying any affiliation, endorsement, or partnership.
We make no representations or warranties, express or implied, regarding the accuracy, completeness, or suitability of any content or products presented. Nothing on this website should be construed as legal, tax, investment, financial, medical, or other professional advice. In addition, no part of this site—including articles or product references—constitutes a solicitation, recommendation, endorsement, advertisement, or offer to buy or sell any securities, franchises, or other financial instruments, particularly in jurisdictions where such activity would be unlawful.
All content is of a general nature and may not address the specific circumstances of any individual or entity. It is not a substitute for professional advice or services. Any actions you take based on the information provided here are strictly at your own risk. You accept full responsibility for any decisions or outcomes arising from your use of this website and agree to release us from any liability in connection with your use of, or reliance upon, the content or products found herein.