
|
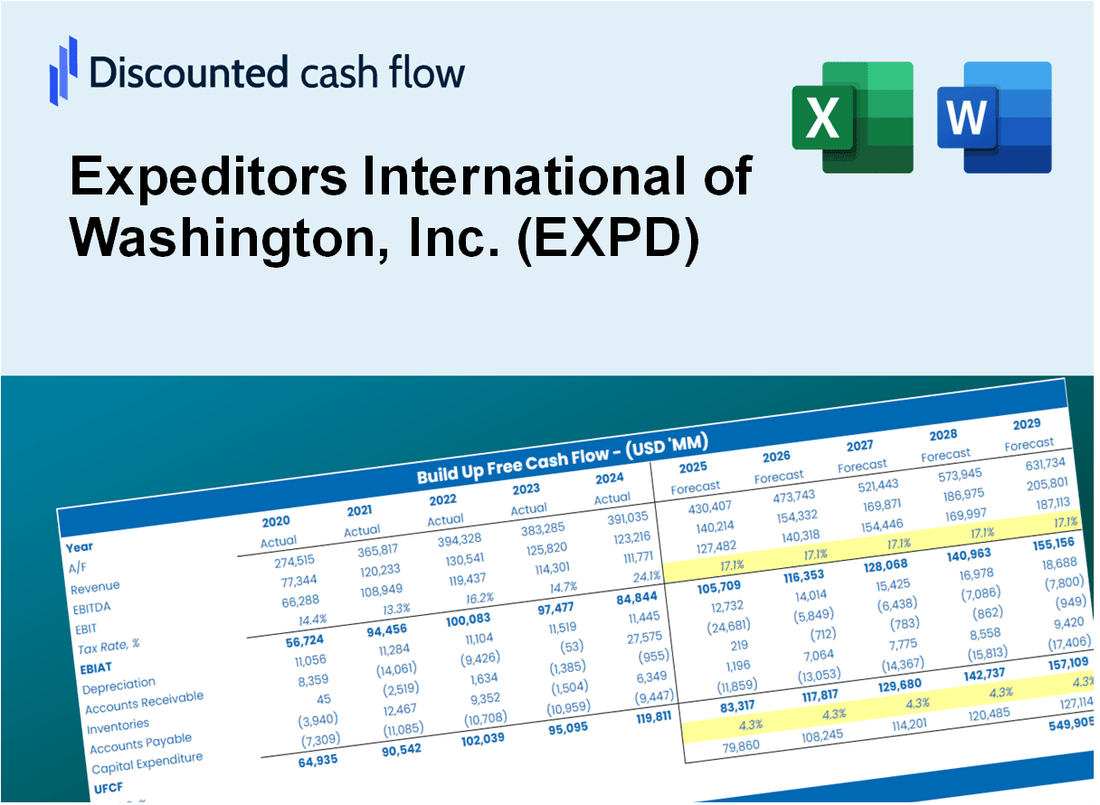
Expeditors International von Washington, Inc. (Expd) DCF -Bewertung |
Fully Editable: Tailor To Your Needs In Excel Or Sheets
Professional Design: Trusted, Industry-Standard Templates
Investor-Approved Valuation Models
MAC/PC Compatible, Fully Unlocked
No Expertise Is Needed; Easy To Follow
Expeditors International of Washington, Inc. (EXPD) Bundle
Vereinfachen Sie die Bewertung von Expeditors International von Washington, Inc. (EXPD) mit diesem anpassbaren DCF -Taschenrechner! Mit Real Expeditors International von Washington, Inc. (Expd) Financials und einstellbaren Prognoseeingaben können Sie Szenarien testen und Expeditors International von Washington, Inc. (EXPD) in Minuten aufdecken.
What You Will Get
- Real EXPD Financials: Access to historical and projected data for precise valuation.
- Customizable Inputs: Adjust WACC, tax rates, revenue growth, and capital expenditures to fit your analysis.
- Instant Calculations: Intrinsic value and NPV are computed in real-time.
- Scenario Analysis: Evaluate various scenarios to assess Expeditors International's future performance.
- User-Friendly Interface: Designed for professionals but easy enough for newcomers to navigate.
Key Features
- Comprehensive EXPD Data: Pre-loaded with Expeditors’ historical performance metrics and future growth estimates.
- Customizable Financial Inputs: Modify revenue projections, profit margins, discount rates, tax assumptions, and capital investments.
- Interactive Valuation Framework: Automatically refreshes Net Present Value (NPV) and intrinsic value as inputs are adjusted.
- Forecast Scenario Analysis: Develop various forecasting scenarios to evaluate different valuation results.
- Intuitive User Interface: Designed to be straightforward and accessible for both industry experts and newcomers.
How It Works
- Step 1: Download the prebuilt Excel template featuring Expeditors International's (EXPD) data.
- Step 2: Navigate through the pre-filled sheets to grasp the essential metrics.
- Step 3: Modify forecasts and assumptions in the editable yellow cells (WACC, growth, margins).
- Step 4: Instantly see the updated results, including Expeditors International's intrinsic value.
- Step 5: Utilize the outputs to make informed investment decisions or create reports.
Why Choose Expeditors International of Washington, Inc. (EXPD)?
- Comprehensive Services: Offers a full range of logistics, freight forwarding, and supply chain solutions.
- Customizable Solutions: Tailor services to meet specific client needs and operational requirements.
- Expert Insights: Provides detailed analytics and reporting for enhanced decision-making.
- Robust Network: Leverages a global network for efficient and reliable transportation services.
- Industry Expertise: Trusted by businesses worldwide for exceptional service and support.
Who Should Use This Product?
- Logistics Students: Discover supply chain management principles and apply them with real-world examples.
- Researchers: Utilize industry-standard models in your studies or academic projects.
- Supply Chain Analysts: Validate your strategies and evaluate performance metrics for Expeditors International (EXPD).
- Business Consultants: Enhance your analysis with a ready-to-use, adaptable logistics model.
- Entrepreneurs: Learn how major logistics firms like Expeditors International (EXPD) operate and are evaluated.
What the Template Contains
- Historical Data: Includes Expeditors International's past financials and baseline forecasts.
- DCF and Levered DCF Models: Detailed templates to calculate Expeditors International's intrinsic value.
- WACC Sheet: Pre-built calculations for Weighted Average Cost of Capital.
- Editable Inputs: Modify key drivers like growth rates, EBITDA %, and CAPEX assumptions.
- Quarterly and Annual Statements: A complete breakdown of Expeditors International's financials.
- Interactive Dashboard: Visualize valuation results and projections dynamically.
Disclaimer
All information, articles, and product details provided on this website are for general informational and educational purposes only. We do not claim any ownership over, nor do we intend to infringe upon, any trademarks, copyrights, logos, brand names, or other intellectual property mentioned or depicted on this site. Such intellectual property remains the property of its respective owners, and any references here are made solely for identification or informational purposes, without implying any affiliation, endorsement, or partnership.
We make no representations or warranties, express or implied, regarding the accuracy, completeness, or suitability of any content or products presented. Nothing on this website should be construed as legal, tax, investment, financial, medical, or other professional advice. In addition, no part of this site—including articles or product references—constitutes a solicitation, recommendation, endorsement, advertisement, or offer to buy or sell any securities, franchises, or other financial instruments, particularly in jurisdictions where such activity would be unlawful.
All content is of a general nature and may not address the specific circumstances of any individual or entity. It is not a substitute for professional advice or services. Any actions you take based on the information provided here are strictly at your own risk. You accept full responsibility for any decisions or outcomes arising from your use of this website and agree to release us from any liability in connection with your use of, or reliance upon, the content or products found herein.