
|
Eyepoint Pharmaceuticals, Inc. (EYPT) DCF -Bewertung |
Fully Editable: Tailor To Your Needs In Excel Or Sheets
Professional Design: Trusted, Industry-Standard Templates
Investor-Approved Valuation Models
MAC/PC Compatible, Fully Unlocked
No Expertise Is Needed; Easy To Follow
EyePoint Pharmaceuticals, Inc. (EYPT) Bundle
Unabhängig davon, ob Sie ein Investor oder Analyst sind, ist dieser (EYPT) DCF-Taschenrechner Ihre Anlaufstelle für eine genaue Bewertung. Mit echten Daten von EyePoint Pharmaceuticals, Inc., können Sie Prognosen anpassen und die Auswirkungen sofort beobachten.
Discounted Cash Flow (DCF) - (USD MM)
| Year | AY1 2020 |
AY2 2021 |
AY3 2022 |
AY4 2023 |
AY5 2024 |
FY1 2025 |
FY2 2026 |
FY3 2027 |
FY4 2028 |
FY5 2029 |
|---|---|---|---|---|---|---|---|---|---|---|
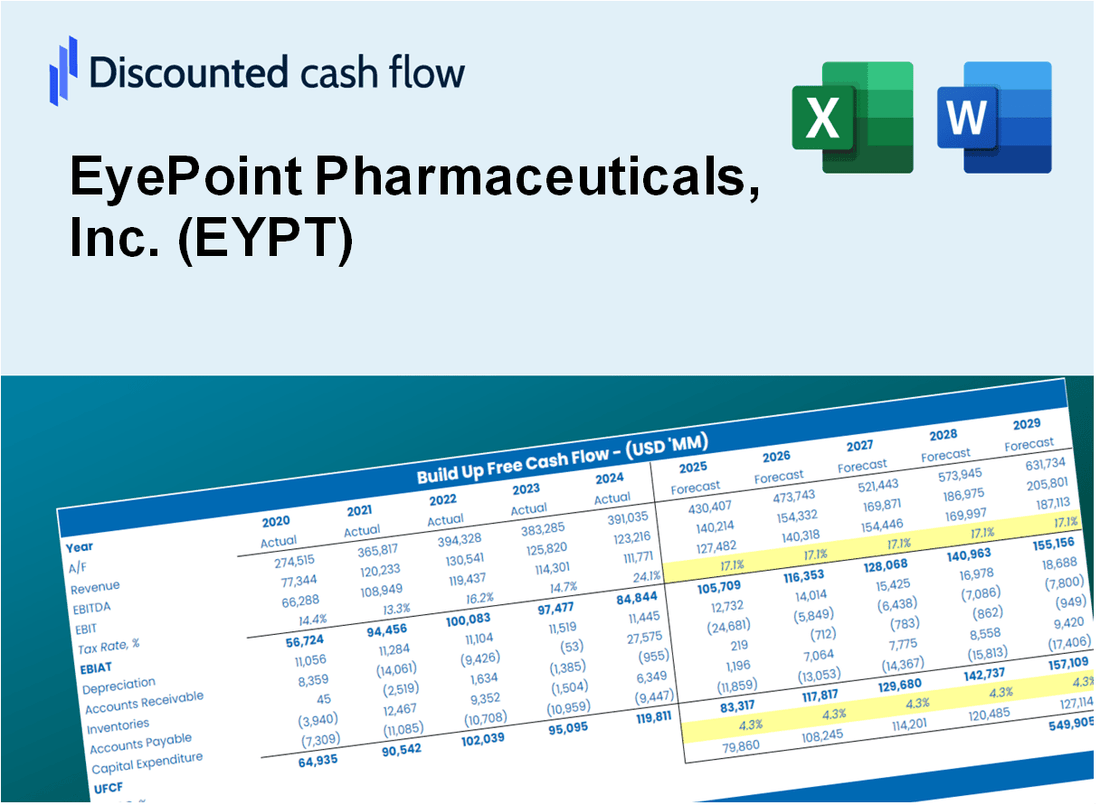
| Revenue | 34.4 | 36.9 | 41.4 | 46.0 | 43.3 | 45.9 | 48.7 | 51.7 | 54.9 | 58.3 |
| Revenue Growth, % | 0 | 7.27 | 12.09 | 11.14 | -5.97 | 6.13 | 6.13 | 6.13 | 6.13 | 6.13 |
| EBITDA | -35.5 | -50.1 | -96.6 | -69.0 | -129.2 | -45.9 | -48.7 | -51.7 | -54.9 | -58.3 |
| EBITDA, % | -103.05 | -135.76 | -233.36 | -149.94 | -298.63 | -100 | -100 | -100 | -100 | -100 |
| Depreciation | 2.6 | 2.8 | 2.4 | .5 | 1.5 | 2.4 | 2.5 | 2.7 | 2.8 | 3.0 |
| Depreciation, % | 7.69 | 7.5 | 5.91 | 1.01 | 3.56 | 5.13 | 5.13 | 5.13 | 5.13 | 5.13 |
| EBIT | -38.1 | -52.9 | -99.1 | -69.5 | -130.8 | -45.9 | -48.7 | -51.7 | -54.9 | -58.3 |
| EBIT, % | -110.74 | -143.26 | -239.26 | -150.95 | -302.19 | -100 | -100 | -100 | -100 | -100 |
| Total Cash | 44.9 | 211.6 | 144.6 | 331.1 | 370.9 | 45.9 | 48.7 | 51.7 | 54.9 | 58.3 |
| Total Cash, percent | .0 | .0 | .0 | .0 | .0 | .0 | .0 | .0 | .0 | .0 |
| Account Receivables | 9.5 | 18.4 | 15.5 | .8 | .6 | 10.8 | 11.5 | 12.2 | 12.9 | 13.7 |
| Account Receivables, % | 27.45 | 49.69 | 37.44 | 1.75 | 1.4 | 23.55 | 23.55 | 23.55 | 23.55 | 23.55 |
| Inventories | 5.3 | 3.6 | 2.9 | 3.9 | 2.3 | 4.2 | 4.5 | 4.8 | 5.1 | 5.4 |
| Inventories, % | 15.5 | 9.79 | 6.97 | 8.49 | 5.33 | 9.21 | 9.21 | 9.21 | 9.21 | 9.21 |
| Accounts Payable | 4.8 | 7.4 | 5.9 | 6.5 | 11.7 | 8.2 | 8.7 | 9.3 | 9.8 | 10.4 |
| Accounts Payable, % | 13.97 | 19.99 | 14.3 | 14.13 | 27.09 | 17.9 | 17.9 | 17.9 | 17.9 | 17.9 |
| Capital Expenditure | -.4 | -.2 | -2.2 | -3.5 | -4.1 | -2.2 | -2.3 | -2.4 | -2.6 | -2.8 |
| Capital Expenditure, % | -1.05 | -0.42232 | -5.19 | -7.57 | -9.36 | -4.72 | -4.72 | -4.72 | -4.72 | -4.72 |
| Tax Rate, % | -0.06881786 | -0.06881786 | -0.06881786 | -0.06881786 | -0.06881786 | -0.06881786 | -0.06881786 | -0.06881786 | -0.06881786 | -0.06881786 |
| EBITAT | -38.1 | -52.9 | -99.1 | -69.5 | -130.9 | -45.9 | -48.7 | -51.7 | -54.9 | -58.3 |
| Depreciation | ||||||||||
| Changes in Account Receivables | ||||||||||
| Changes in Inventories | ||||||||||
| Changes in Accounts Payable | ||||||||||
| Capital Expenditure | ||||||||||
| UFCF | -45.8 | -54.9 | -96.7 | -58.3 | -126.4 | -61.4 | -49.0 | -52.0 | -55.2 | -58.5 |
| WACC, % | 11.47 | 11.47 | 11.47 | 11.47 | 11.47 | 11.47 | 11.47 | 11.47 | 11.47 | 11.47 |
| PV UFCF | ||||||||||
| SUM PV UFCF | -201.7 | |||||||||
| Long Term Growth Rate, % | 2.00 | |||||||||
| Free cash flow (T + 1) | -60 | |||||||||
| Terminal Value | -630 | |||||||||
| Present Terminal Value | -366 | |||||||||
| Enterprise Value | -568 | |||||||||
| Net Debt | -78 | |||||||||
| Equity Value | -490 | |||||||||
| Diluted Shares Outstanding, MM | 56 | |||||||||
| Equity Value Per Share | -8.70 |
What You Will Get
- Real EYPT Financials: Access to historical and projected data for precise valuation.
- Customizable Inputs: Adjust WACC, tax rates, revenue growth, and capital expenditures as needed.
- Dynamic Calculations: Intrinsic value and NPV are computed in real-time.
- Scenario Analysis: Evaluate various scenarios to assess EyePoint's future performance.
- User-Friendly Design: Crafted for professionals while remaining approachable for newcomers.
Key Features
- Customizable Forecast Inputs: Adjust essential parameters such as revenue growth, operating margin, and R&D expenditures.
- Instant DCF Valuation: Automatically computes intrinsic value, NPV, and additional metrics in real-time.
- High-Precision Accuracy: Leverages EyePoint Pharmaceuticals' actual financial data for accurate valuation results.
- Streamlined Scenario Analysis: Effortlessly evaluate various assumptions and analyze different outcomes.
- Efficiency Booster: Avoid the hassle of creating intricate valuation models from the ground up.
How It Works
- Download: Obtain the pre-formatted Excel file containing EyePoint Pharmaceuticals, Inc.'s (EYPT) financial data.
- Customize: Modify forecasts such as revenue growth, EBITDA %, and WACC to fit your analysis.
- Update Automatically: Watch as the intrinsic value and NPV calculations refresh in real-time.
- Test Scenarios: Generate various projections and assess results immediately.
- Make Decisions: Leverage the valuation insights to inform your investment approach.
Why Choose EyePoint Pharmaceuticals, Inc. (EYPT)?
- Innovative Solutions: Cutting-edge treatments designed to address unmet medical needs.
- Proven Track Record: A history of successful product development and commercialization.
- Dedicated Research: Commitment to advancing ocular therapeutics through rigorous research.
- Patient-Centric Approach: Focused on improving patient outcomes and quality of life.
- Expert Team: Led by industry professionals with extensive experience in pharmaceuticals.
Who Should Use This Product?
- Investors: Evaluate EyePoint Pharmaceuticals' (EYPT) market potential and fair value prior to making investment choices.
- CFOs: Utilize a sophisticated DCF model for accurate financial reporting and analysis related to EyePoint Pharmaceuticals.
- Consultants: Efficiently customize the template for valuation reports tailored to EyePoint Pharmaceuticals' clients.
- Entrepreneurs: Discover financial modeling strategies employed by leading pharmaceutical companies.
- Educators: Incorporate it as a resource to teach valuation techniques in the pharmaceutical sector.
What the Template Contains
- Preloaded EYPT Data: Historical and projected financial data, including revenue, EBIT, and capital expenditures.
- DCF and WACC Models: Professional-grade sheets for calculating intrinsic value and Weighted Average Cost of Capital.
- Editable Inputs: Yellow-highlighted cells for adjusting revenue growth, tax rates, and discount rates.
- Financial Statements: Comprehensive annual and quarterly financials for deeper analysis.
- Key Ratios: Profitability, leverage, and efficiency ratios to evaluate performance.
- Dashboard and Charts: Visual summaries of valuation outcomes and assumptions.
Disclaimer
All information, articles, and product details provided on this website are for general informational and educational purposes only. We do not claim any ownership over, nor do we intend to infringe upon, any trademarks, copyrights, logos, brand names, or other intellectual property mentioned or depicted on this site. Such intellectual property remains the property of its respective owners, and any references here are made solely for identification or informational purposes, without implying any affiliation, endorsement, or partnership.
We make no representations or warranties, express or implied, regarding the accuracy, completeness, or suitability of any content or products presented. Nothing on this website should be construed as legal, tax, investment, financial, medical, or other professional advice. In addition, no part of this site—including articles or product references—constitutes a solicitation, recommendation, endorsement, advertisement, or offer to buy or sell any securities, franchises, or other financial instruments, particularly in jurisdictions where such activity would be unlawful.
All content is of a general nature and may not address the specific circumstances of any individual or entity. It is not a substitute for professional advice or services. Any actions you take based on the information provided here are strictly at your own risk. You accept full responsibility for any decisions or outcomes arising from your use of this website and agree to release us from any liability in connection with your use of, or reliance upon, the content or products found herein.