
|
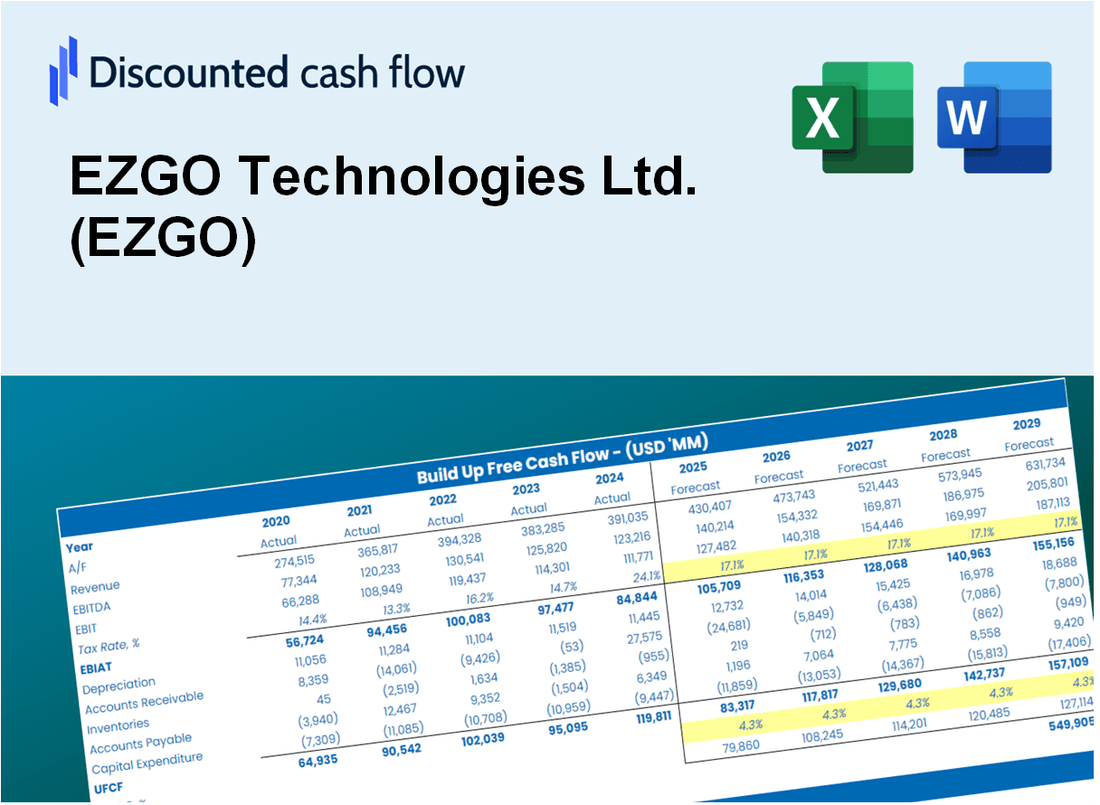
EZGO Technologies Ltd. (EZGO) DCF -Bewertung |
Fully Editable: Tailor To Your Needs In Excel Or Sheets
Professional Design: Trusted, Industry-Standard Templates
Investor-Approved Valuation Models
MAC/PC Compatible, Fully Unlocked
No Expertise Is Needed; Easy To Follow
EZGO Technologies Ltd. (EZGO) Bundle
Unsere DCF-Taschenrechnerin für Genauigkeit entwickelt, die EZGO (EZGO) ermöglicht, die Bewertung von EZGO Technologies Ltd. unter Verwendung realer Finanzdaten zu bewerten und vollständige Flexibilität zu bieten, um alle wesentlichen Parameter für erweiterte Projektionen zu ändern.
What You Will Get
- Editable Forecast Inputs: Easily adjust assumptions (growth %, margins, WACC) to explore various scenarios.
- Real-World Data: EZGO Technologies Ltd.’s (EZGO) financial data pre-filled to kickstart your analysis.
- Automatic DCF Outputs: The template computes Net Present Value (NPV) and intrinsic value automatically.
- Customizable and Professional: A sleek Excel model tailored to meet your valuation requirements.
- Built for Analysts and Investors: Perfect for evaluating projections, confirming strategies, and enhancing efficiency.
Key Features
- Comprehensive Financial Data: Gain access to precise historical data and future forecasts for EZGO Technologies Ltd. (EZGO).
- Adjustable Projection Parameters: Modify highlighted cells for key metrics such as WACC, growth rates, and profit margins.
- Real-Time Calculations: Automatic recalculations for DCF, Net Present Value (NPV), and cash flow assessments.
- User-Friendly Dashboard: Intuitive charts and summaries to help visualize your valuation findings.
- Designed for All Skill Levels: A straightforward layout tailored for investors, CFOs, and consultants alike.
How It Works
- 1. Access the Template: Download and open the Excel file containing EZGO Technologies Ltd.'s preloaded data.
- 2. Adjust Assumptions: Modify key inputs such as growth rates, WACC, and capital expenditures.
- 3. View Results Instantly: The DCF model automatically calculates intrinsic value and NPV based on your inputs.
- 4. Explore Scenarios: Analyze various forecasts to evaluate different valuation outcomes.
- 5. Present with Confidence: Share professional valuation insights to back your strategic decisions.
Why Choose EZGO Technologies Ltd. (EZGO) Calculator?
- User-Friendly Interface: Tailored for both novices and seasoned professionals.
- Customizable Inputs: Effortlessly adjust parameters to suit your specific analysis.
- Real-Time Adjustments: Observe immediate changes in EZGO’s valuation as you tweak the inputs.
- Preloaded Financial Data: Comes equipped with EZGO’s actual financial metrics for swift evaluations.
- Preferred by Experts: Utilized by investors and analysts for making well-informed decisions.
Who Should Use EZGO Technologies Ltd. (EZGO)?
- Investors: Evaluate EZGO’s market position before making investment decisions.
- CFOs and Financial Analysts: Optimize valuation methods and assess financial forecasts.
- Startup Founders: Discover how technology companies like EZGO are appraised.
- Consultants: Provide expert valuation assessments for clients in the tech sector.
- Students and Educators: Utilize current data to study and teach valuation practices.
What the Template Contains
- Pre-Filled DCF Model: EZGO Technologies Ltd.’s (EZGO) financial data preloaded for immediate use.
- WACC Calculator: Detailed calculations for Weighted Average Cost of Capital.
- Financial Ratios: Evaluate EZGO’s profitability, leverage, and efficiency.
- Editable Inputs: Change assumptions such as growth, margins, and CAPEX to fit your scenarios.
- Financial Statements: Annual and quarterly reports to support detailed analysis.
- Interactive Dashboard: Easily visualize key valuation metrics and results.
Disclaimer
All information, articles, and product details provided on this website are for general informational and educational purposes only. We do not claim any ownership over, nor do we intend to infringe upon, any trademarks, copyrights, logos, brand names, or other intellectual property mentioned or depicted on this site. Such intellectual property remains the property of its respective owners, and any references here are made solely for identification or informational purposes, without implying any affiliation, endorsement, or partnership.
We make no representations or warranties, express or implied, regarding the accuracy, completeness, or suitability of any content or products presented. Nothing on this website should be construed as legal, tax, investment, financial, medical, or other professional advice. In addition, no part of this site—including articles or product references—constitutes a solicitation, recommendation, endorsement, advertisement, or offer to buy or sell any securities, franchises, or other financial instruments, particularly in jurisdictions where such activity would be unlawful.
All content is of a general nature and may not address the specific circumstances of any individual or entity. It is not a substitute for professional advice or services. Any actions you take based on the information provided here are strictly at your own risk. You accept full responsibility for any decisions or outcomes arising from your use of this website and agree to release us from any liability in connection with your use of, or reliance upon, the content or products found herein.