
|
Festung Biotech, Inc. (FBIO) DCF -Bewertung |
Fully Editable: Tailor To Your Needs In Excel Or Sheets
Professional Design: Trusted, Industry-Standard Templates
Investor-Approved Valuation Models
MAC/PC Compatible, Fully Unlocked
No Expertise Is Needed; Easy To Follow
Fortress Biotech, Inc. (FBIO) Bundle
Unser (FBIO) DCF-Taschenrechner entwickelt für Genauigkeit und ermöglicht es Ihnen, die Bewertung von Fortress Biotech, Inc. unter Verwendung realer Finanzdaten zu bewerten und gleichzeitig vollständige Flexibilität zu bieten, um alle wesentlichen Parameter für verbesserte Projektionen zu ändern.
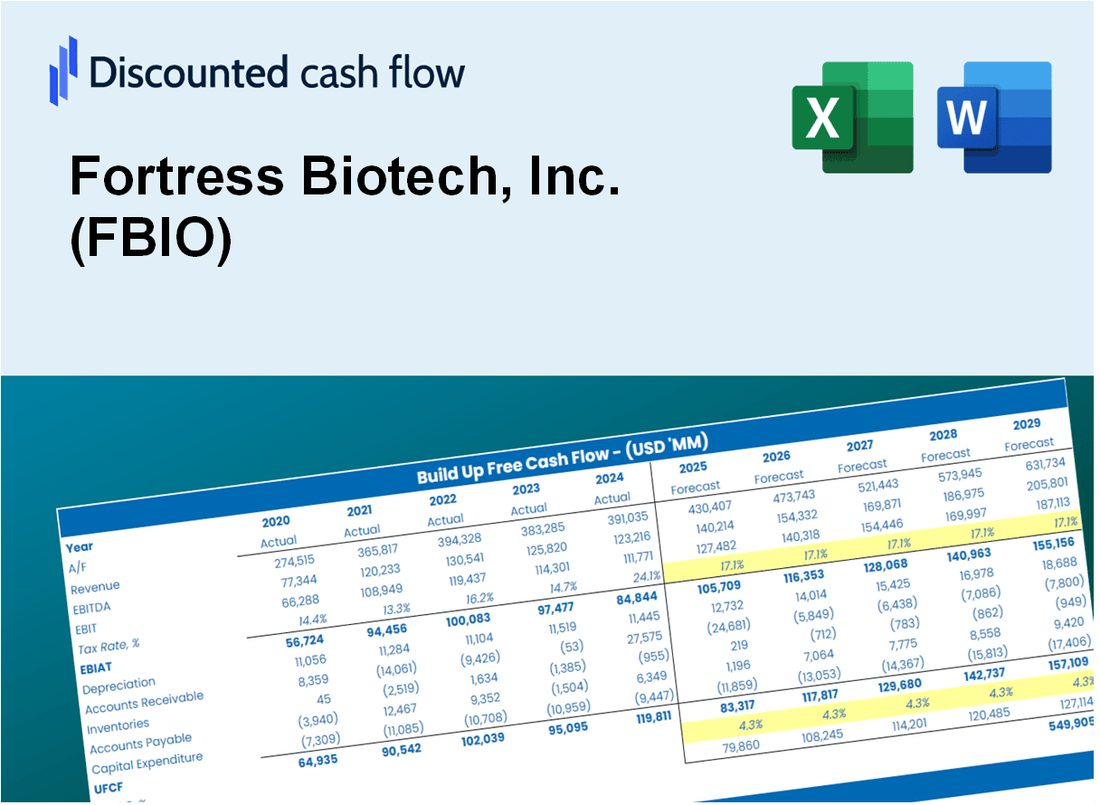
Discounted Cash Flow (DCF) - (USD MM)
| Year | AY1 2020 |
AY2 2021 |
AY3 2022 |
AY4 2023 |
AY5 2024 |
FY1 2025 |
FY2 2026 |
FY3 2027 |
FY4 2028 |
FY5 2029 |
|---|---|---|---|---|---|---|---|---|---|---|
| Revenue | 45.6 | 68.8 | 75.7 | 84.5 | 57.7 | 63.6 | 70.0 | 77.2 | 85.0 | 93.7 |
| Revenue Growth, % | 0 | 50.86 | 10.11 | 11.58 | -31.76 | 10.2 | 10.2 | 10.2 | 10.2 | 10.2 |
| EBITDA | -87.8 | -146.2 | -190.5 | -135.7 | -104.5 | -63.6 | -70.0 | -77.2 | -85.0 | -93.7 |
| EBITDA, % | -192.59 | -212.48 | -251.47 | -160.59 | -181.17 | -100 | -100 | -100 | -100 | -100 |
| Depreciation | 5.3 | 6.8 | 9.4 | 6.0 | 4.5 | 6.2 | 6.8 | 7.5 | 8.3 | 9.1 |
| Depreciation, % | 11.68 | 9.87 | 12.35 | 7.1 | 7.74 | 9.75 | 9.75 | 9.75 | 9.75 | 9.75 |
| EBIT | -93.1 | -153.0 | -199.8 | -141.7 | -109.0 | -63.6 | -70.0 | -77.2 | -85.0 | -93.7 |
| EBIT, % | -204.27 | -222.35 | -263.82 | -167.69 | -188.91 | -100 | -100 | -100 | -100 | -100 |
| Total Cash | 233.4 | 305.7 | 178.3 | 80.9 | 57.3 | 62.9 | 69.3 | 76.4 | 84.2 | 92.8 |
| Total Cash, percent | .0 | .0 | .0 | .0 | .0 | .0 | .0 | .0 | .0 | .0 |
| Account Receivables | 19.3 | 23.8 | 28.3 | 15.4 | 10.4 | 19.2 | 21.1 | 23.3 | 25.6 | 28.2 |
| Account Receivables, % | 42.43 | 34.58 | 37.42 | 18.21 | 18.04 | 30.14 | 30.14 | 30.14 | 30.14 | 30.14 |
| Inventories | 1.4 | 9.9 | 14.2 | 10.2 | 14.4 | 9.3 | 10.3 | 11.3 | 12.5 | 13.7 |
| Inventories, % | 3.08 | 14.34 | 18.69 | 12.08 | 25.02 | 14.64 | 14.64 | 14.64 | 14.64 | 14.64 |
| Accounts Payable | 11.4 | 47.4 | 57.2 | 34.8 | 31.6 | 33.8 | 37.2 | 41.0 | 45.2 | 49.8 |
| Accounts Payable, % | 25.03 | 68.95 | 75.58 | 41.19 | 54.85 | 53.12 | 53.12 | 53.12 | 53.12 | 53.12 |
| Capital Expenditure | -7.2 | -16.3 | -3.1 | -8.1 | -15.0 | -10.1 | -11.1 | -12.2 | -13.5 | -14.8 |
| Capital Expenditure, % | -15.71 | -23.76 | -4.03 | -9.58 | -26.01 | -15.82 | -15.82 | -15.82 | -15.82 | -15.82 |
| Tax Rate, % | 61.84 | 61.84 | 61.84 | 61.84 | 61.84 | 61.84 | 61.84 | 61.84 | 61.84 | 61.84 |
| EBITAT | -42.1 | -60.2 | -81.0 | -55.9 | -41.6 | -25.8 | -28.4 | -31.3 | -34.5 | -38.0 |
| Depreciation | ||||||||||
| Changes in Account Receivables | ||||||||||
| Changes in Inventories | ||||||||||
| Changes in Accounts Payable | ||||||||||
| Capital Expenditure | ||||||||||
| UFCF | -53.3 | -46.7 | -73.8 | -63.6 | -54.5 | -31.1 | -32.1 | -35.4 | -39.0 | -43.0 |
| WACC, % | 8.42 | 7.97 | 8.06 | 7.97 | 7.87 | 8.06 | 8.06 | 8.06 | 8.06 | 8.06 |
| PV UFCF | ||||||||||
| SUM PV UFCF | -142.2 | |||||||||
| Long Term Growth Rate, % | 2.00 | |||||||||
| Free cash flow (T + 1) | -44 | |||||||||
| Terminal Value | -724 | |||||||||
| Present Terminal Value | -491 | |||||||||
| Enterprise Value | -633 | |||||||||
| Net Debt | 19 | |||||||||
| Equity Value | -652 | |||||||||
| Diluted Shares Outstanding, MM | 21 | |||||||||
| Equity Value Per Share | -31.37 |
What You Will Get
- Pre-Filled Financial Model: Fortress Biotech’s actual data enables precise DCF valuation.
- Full Forecast Control: Adjust revenue growth, margins, WACC, and other key drivers.
- Instant Calculations: Automatic updates ensure you see results as you make changes.
- Investor-Ready Template: A refined Excel file designed for professional-grade valuation.
- Customizable and Reusable: Tailored for flexibility, allowing repeated use for detailed forecasts.
Key Features
- Customizable Clinical Parameters: Adjust essential inputs such as research and development costs, market penetration rates, and projected revenue growth.
- Instant DCF Valuation: Quickly computes intrinsic value, net present value (NPV), and other financial metrics.
- High-Precision Results: Leverages Fortress Biotech’s actual financial data for accurate valuation insights.
- Effortless Scenario Analysis: Easily evaluate various assumptions and analyze different potential outcomes.
- Efficiency Booster: Streamline the valuation process without the need to create intricate models from the ground up.
How It Works
- Download the Template: Gain immediate access to the Excel-based FBIO DCF Calculator.
- Input Your Assumptions: Modify the yellow-highlighted cells for growth rates, WACC, margins, and additional factors.
- Instant Calculations: The model automatically recalculates Fortress Biotech’s intrinsic value.
- Test Scenarios: Experiment with various assumptions to assess potential changes in valuation.
- Analyze and Decide: Leverage the results to inform your investment or financial analysis.
Why Choose This Calculator for Fortress Biotech, Inc. (FBIO)?
- Designed for Experts: A sophisticated tool utilized by analysts, CFOs, and industry consultants.
- Accurate Data: Fortress Biotech's historical and projected financials preloaded for precision.
- Flexible Scenario Analysis: Effortlessly simulate various forecasts and assumptions.
- Comprehensive Outputs: Automatically computes intrinsic value, NPV, and essential financial metrics.
- User-Friendly: Step-by-step guidance to navigate through the calculations seamlessly.
Who Should Use Fortress Biotech, Inc. (FBIO)?
- Investors: Gain insights into the biotech sector with a robust analysis tool tailored for informed decision-making.
- Financial Analysts: Streamline your workflow with a pre-designed financial model that can be easily customized.
- Consultants: Effortlessly modify the template for impactful client presentations or detailed reports.
- Biotech Enthusiasts: Enhance your knowledge of the industry with practical examples and case studies.
- Educators and Students: Utilize it as an effective resource for teaching and learning in biotechnology and finance courses.
What the Template Contains
- Comprehensive DCF Model: Editable template with detailed valuation calculations tailored for Fortress Biotech, Inc. (FBIO).
- Real-World Data: Fortress Biotech’s historical and projected financials preloaded for thorough analysis.
- Customizable Parameters: Adjust WACC, growth rates, and tax assumptions to explore various scenarios.
- Financial Statements: Complete annual and quarterly breakdowns for enhanced insights.
- Key Ratios: Built-in analysis for profitability, efficiency, and leverage specific to Fortress Biotech, Inc. (FBIO).
- Dashboard with Visual Outputs: Charts and tables providing clear, actionable results for informed decision-making.
Disclaimer
All information, articles, and product details provided on this website are for general informational and educational purposes only. We do not claim any ownership over, nor do we intend to infringe upon, any trademarks, copyrights, logos, brand names, or other intellectual property mentioned or depicted on this site. Such intellectual property remains the property of its respective owners, and any references here are made solely for identification or informational purposes, without implying any affiliation, endorsement, or partnership.
We make no representations or warranties, express or implied, regarding the accuracy, completeness, or suitability of any content or products presented. Nothing on this website should be construed as legal, tax, investment, financial, medical, or other professional advice. In addition, no part of this site—including articles or product references—constitutes a solicitation, recommendation, endorsement, advertisement, or offer to buy or sell any securities, franchises, or other financial instruments, particularly in jurisdictions where such activity would be unlawful.
All content is of a general nature and may not address the specific circumstances of any individual or entity. It is not a substitute for professional advice or services. Any actions you take based on the information provided here are strictly at your own risk. You accept full responsibility for any decisions or outcomes arising from your use of this website and agree to release us from any liability in connection with your use of, or reliance upon, the content or products found herein.