
|
Forte Biosciences, Inc. (FBRX) DCF -Bewertung |
Fully Editable: Tailor To Your Needs In Excel Or Sheets
Professional Design: Trusted, Industry-Standard Templates
Investor-Approved Valuation Models
MAC/PC Compatible, Fully Unlocked
No Expertise Is Needed; Easy To Follow
Forte Biosciences, Inc. (FBRX) Bundle
Entdecken Sie das wahre Potenzial von Forte Biosciences, Inc. (FBRX) mit unserem fortschrittlichen DCF -Taschenrechner! Passen Sie die Schlüsselvariablen an, erkunden Sie verschiedene Szenarien und bewerten Sie, wie sich Veränderungen auf die Bewertung von Forte Biosciences, Inc. (FBRX) auswirken - alles innerhalb einer umfassenden Excel -Vorlage.
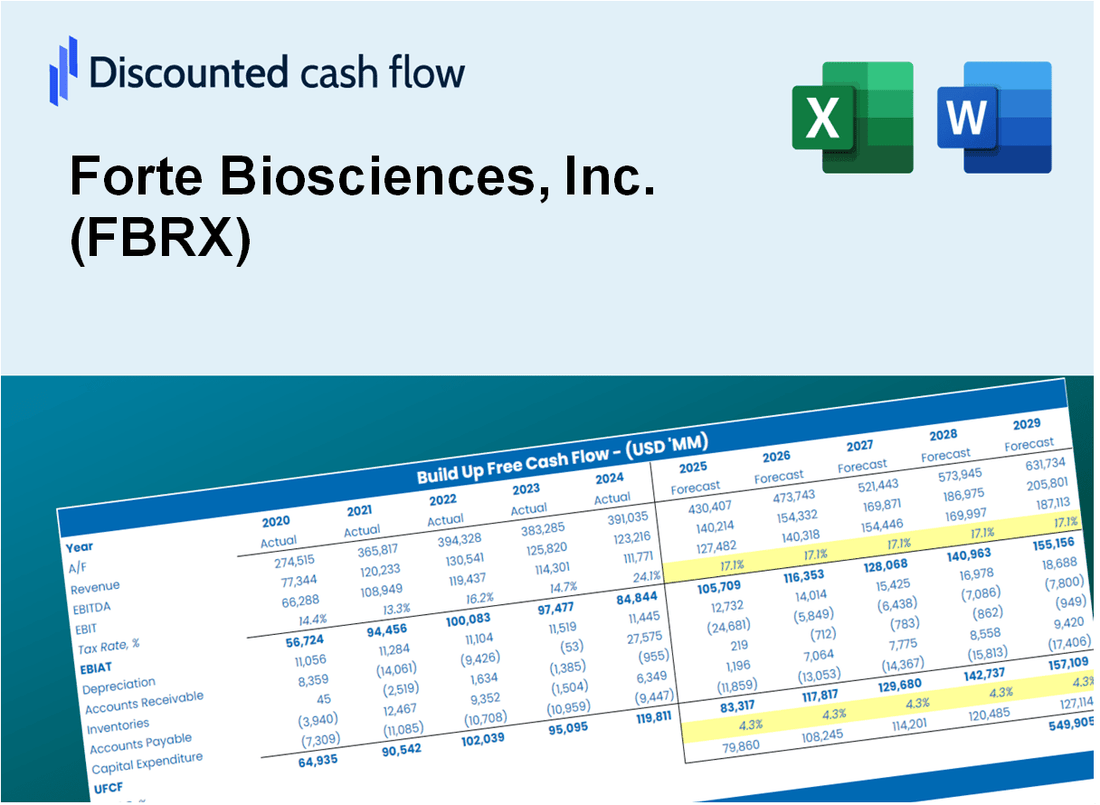
Discounted Cash Flow (DCF) - (USD MM)
| Year | AY1 2020 |
AY2 2021 |
AY3 2022 |
AY4 2023 |
AY5 2024 |
FY1 2025 |
FY2 2026 |
FY3 2027 |
FY4 2028 |
FY5 2029 |
|---|---|---|---|---|---|---|---|---|---|---|
| Revenue | .0 | .0 | .0 | .0 | .0 | .0 | .0 | .0 | .0 | .0 |
| Revenue Growth, % | 0 | 0 | 0 | 0 | 0 | 0 | 0 | 0 | 0 | 0 |
| EBITDA | -46.4 | -21.5 | -13.9 | -32.5 | -35.4 | .0 | .0 | .0 | .0 | .0 |
| EBITDA, % | 100 | 100 | 100 | 100 | 100 | 100 | 100 | 100 | 100 | 100 |
| Depreciation | .1 | .0 | .0 | .0 | .0 | .0 | .0 | .0 | .0 | .0 |
| Depreciation, % | 100 | 100 | 100 | 100 | 100 | 100 | 100 | 100 | 100 | 100 |
| EBIT | -46.5 | -21.5 | -13.9 | -32.5 | -35.5 | .0 | .0 | .0 | .0 | .0 |
| EBIT, % | 100 | 100 | 100 | 100 | 100 | 100 | 100 | 100 | 100 | 100 |
| Total Cash | 58.8 | 42.0 | 41.1 | 37.1 | 58.4 | .0 | .0 | .0 | .0 | .0 |
| Total Cash, percent | .0 | .0 | .0 | .0 | .0 | .0 | .0 | .0 | .0 | .0 |
| Account Receivables | .0 | .0 | .0 | .0 | .0 | .0 | .0 | .0 | .0 | .0 |
| Account Receivables, % | 100 | 100 | 100 | 100 | 100 | 100 | 100 | 100 | 100 | 100 |
| Inventories | .0 | .0 | .0 | .0 | .0 | .0 | .0 | .0 | .0 | .0 |
| Inventories, % | 100 | 100 | 100 | 100 | 100 | 100 | 100 | 100 | 100 | 100 |
| Accounts Payable | 1.2 | .9 | 1.2 | 1.4 | 4.9 | .0 | .0 | .0 | .0 | .0 |
| Accounts Payable, % | 100 | 100 | 100 | 100 | 100 | 100 | 100 | 100 | 100 | 100 |
| Capital Expenditure | .0 | .0 | .0 | -.1 | .0 | .0 | .0 | .0 | .0 | .0 |
| Capital Expenditure, % | 100 | 100 | 100 | 100 | 100 | 0 | 0 | 0 | 0 | 0 |
| Tax Rate, % | 0 | 0 | 0 | 0 | 0 | 0 | 0 | 0 | 0 | 0 |
| EBITAT | -78.5 | -21.5 | -13.9 | -32.5 | -35.5 | .0 | .0 | .0 | .0 | .0 |
| Depreciation | ||||||||||
| Changes in Account Receivables | ||||||||||
| Changes in Inventories | ||||||||||
| Changes in Accounts Payable | ||||||||||
| Capital Expenditure | ||||||||||
| UFCF | -77.3 | -21.7 | -13.7 | -32.3 | -32.0 | -4.9 | .0 | .0 | .0 | .0 |
| WACC, % | 17.88 | 17.88 | 17.88 | 17.88 | 17.88 | 17.88 | 17.88 | 17.88 | 17.88 | 17.88 |
| PV UFCF | ||||||||||
| SUM PV UFCF | -4.1 | |||||||||
| Long Term Growth Rate, % | 2.00 | |||||||||
| Free cash flow (T + 1) | 0 | |||||||||
| Terminal Value | 0 | |||||||||
| Present Terminal Value | 0 | |||||||||
| Enterprise Value | -4 | |||||||||
| Net Debt | -22 | |||||||||
| Equity Value | 18 | |||||||||
| Diluted Shares Outstanding, MM | 3 | |||||||||
| Equity Value Per Share | 6.21 |
What You Will Get
- Editable Excel Template: A fully customizable Excel-based DCF Calculator featuring pre-filled real FBRX financials.
- Real-World Data: Historical data and forward-looking estimates (as highlighted in the yellow cells).
- Forecast Flexibility: Adjust forecast assumptions such as revenue growth, EBITDA %, and WACC.
- Automatic Calculations: Instantly observe the effect of your inputs on Forte Biosciences' valuation.
- Professional Tool: Designed for investors, CFOs, consultants, and financial analysts.
- User-Friendly Design: Organized for clarity and ease of use, complete with step-by-step instructions.
Key Features
- Comprehensive DCF Calculator: Features detailed unlevered and levered DCF valuation models tailored for Forte Biosciences, Inc. (FBRX).
- WACC Calculator: Pre-configured Weighted Average Cost of Capital sheet with adjustable inputs specific to the biotech sector.
- Customizable Forecast Assumptions: Adjust growth projections, capital expenditures, and discount rates according to market conditions.
- Integrated Financial Ratios: Evaluate profitability, leverage, and efficiency ratios for Forte Biosciences, Inc. (FBRX).
- Interactive Dashboard and Charts: Visual representations provide a summary of essential valuation metrics for straightforward analysis.
How It Works
- Download: Obtain the ready-to-use Excel file containing Forte Biosciences, Inc.'s (FBRX) financial data.
- Customize: Modify forecasts such as revenue growth, EBITDA %, and WACC to suit your analysis.
- Update Automatically: Enjoy real-time updates for intrinsic value and NPV calculations.
- Test Scenarios: Generate various projections and instantly compare the results.
- Make Decisions: Leverage the valuation outcomes to inform your investment approach.
Why Choose This Calculator for Forte Biosciences, Inc. (FBRX)?
- User-Friendly Interface: Perfectly crafted for both novice and seasoned users.
- Customizable Inputs: Adjust parameters easily to suit your analytical needs.
- Real-Time Feedback: Observe immediate changes to Forte Biosciences’ valuation as you modify inputs.
- Pre-Configured Data: Comes with Forte Biosciences’ actual financial metrics for swift evaluation.
- Relied Upon by Experts: Favored by investors and analysts for making well-informed choices.
Who Should Use This Product?
- Biotechnology Students: Explore drug development processes and analyze clinical trial data.
- Researchers: Integrate advanced models into your studies or publications on biopharmaceuticals.
- Investors: Validate your investment strategies and evaluate the market potential of Forte Biosciences, Inc. (FBRX).
- Analysts: Enhance your analysis with a customizable financial model tailored for biotech companies.
- Healthcare Professionals: Understand how public biotech firms like Forte Biosciences, Inc. (FBRX) are evaluated in the market.
What the Template Contains
- Historical Data: Includes Forte Biosciences’ past financials and baseline forecasts.
- DCF and Levered DCF Models: Detailed templates to calculate Forte Biosciences’ intrinsic value.
- WACC Sheet: Pre-built calculations for Weighted Average Cost of Capital.
- Editable Inputs: Modify key drivers like growth rates, EBITDA %, and CAPEX assumptions.
- Quarterly and Annual Statements: A complete breakdown of Forte Biosciences’ financials.
- Interactive Dashboard: Visualize valuation results and projections dynamically.
Disclaimer
All information, articles, and product details provided on this website are for general informational and educational purposes only. We do not claim any ownership over, nor do we intend to infringe upon, any trademarks, copyrights, logos, brand names, or other intellectual property mentioned or depicted on this site. Such intellectual property remains the property of its respective owners, and any references here are made solely for identification or informational purposes, without implying any affiliation, endorsement, or partnership.
We make no representations or warranties, express or implied, regarding the accuracy, completeness, or suitability of any content or products presented. Nothing on this website should be construed as legal, tax, investment, financial, medical, or other professional advice. In addition, no part of this site—including articles or product references—constitutes a solicitation, recommendation, endorsement, advertisement, or offer to buy or sell any securities, franchises, or other financial instruments, particularly in jurisdictions where such activity would be unlawful.
All content is of a general nature and may not address the specific circumstances of any individual or entity. It is not a substitute for professional advice or services. Any actions you take based on the information provided here are strictly at your own risk. You accept full responsibility for any decisions or outcomes arising from your use of this website and agree to release us from any liability in connection with your use of, or reliance upon, the content or products found herein.