
|
FDC Limited (FDC.NS) DCF -Bewertung |
Fully Editable: Tailor To Your Needs In Excel Or Sheets
Professional Design: Trusted, Industry-Standard Templates
Investor-Approved Valuation Models
MAC/PC Compatible, Fully Unlocked
No Expertise Is Needed; Easy To Follow
FDC Limited (FDC.NS) Bundle
Möchten Sie den inneren Wert von FDC Limited bestimmen? Unser FDCNS DCF-Taschenrechner integriert reale Daten mit umfangreichen Anpassungsfunktionen, sodass Sie Ihre Prognosen verfeinern und Ihre Investitionsauswahl optimieren können.
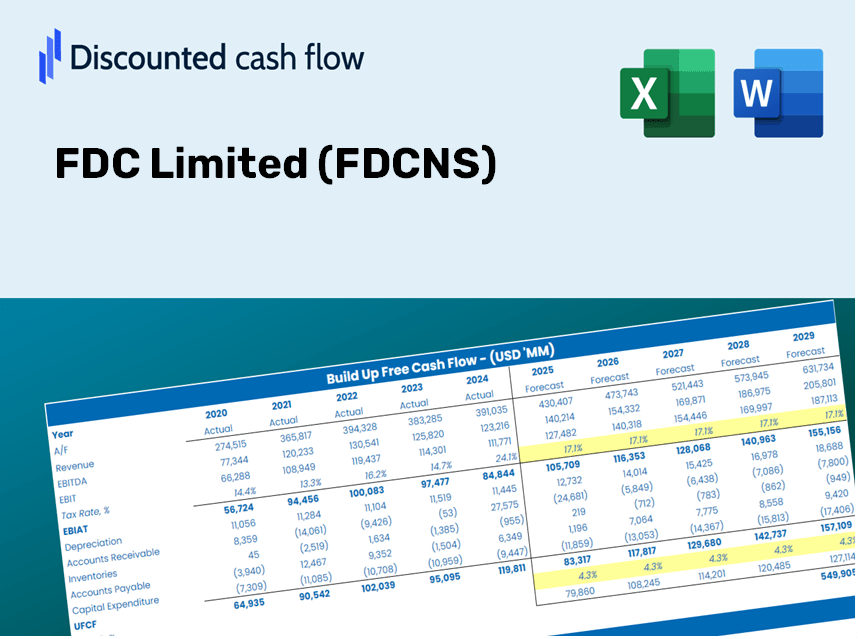
Discounted Cash Flow (DCF) - (USD MM)
| Year | AY1 2021 |
AY2 2022 |
AY3 2023 |
AY4 2024 |
AY5 2025 |
FY1 2026 |
FY2 2027 |
FY3 2028 |
FY4 2029 |
FY5 2030 |
|---|---|---|---|---|---|---|---|---|---|---|
| Revenue | 13,268.3 | 15,257.5 | 17,837.5 | 19,352.0 | 21,081.2 | 23,680.9 | 26,601.3 | 29,881.8 | 33,566.8 | 37,706.3 |
| Revenue Growth, % | 0 | 14.99 | 16.91 | 8.49 | 8.94 | 12.33 | 12.33 | 12.33 | 12.33 | 12.33 |
| EBITDA | 4,289.5 | 3,297.8 | 3,008.3 | 4,401.7 | 4,154.6 | 5,364.3 | 6,025.8 | 6,768.9 | 7,603.7 | 8,541.4 |
| EBITDA, % | 32.33 | 21.61 | 16.87 | 22.75 | 19.71 | 22.65 | 22.65 | 22.65 | 22.65 | 22.65 |
| Depreciation | 378.1 | 373.0 | 389.4 | 399.2 | 537.3 | 572.6 | 643.2 | 722.5 | 811.6 | 911.7 |
| Depreciation, % | 2.85 | 2.44 | 2.18 | 2.06 | 2.55 | 2.42 | 2.42 | 2.42 | 2.42 | 2.42 |
| EBIT | 3,911.4 | 2,924.8 | 2,618.9 | 4,002.5 | 3,617.3 | 4,791.7 | 5,382.6 | 6,046.4 | 6,792.1 | 7,629.7 |
| EBIT, % | 29.48 | 19.17 | 14.68 | 20.68 | 17.16 | 20.23 | 20.23 | 20.23 | 20.23 | 20.23 |
| Total Cash | 5,569.1 | 5,394.3 | 4,839.9 | 4,754.5 | 5,374.2 | 7,318.5 | 8,221.0 | 9,234.8 | 10,373.7 | 11,653.0 |
| Total Cash, percent | .0 | .0 | .0 | .0 | .0 | .0 | .0 | .0 | .0 | .0 |
| Account Receivables | 1,174.1 | 849.7 | 1,243.5 | 1,252.2 | 1,102.9 | 1,567.3 | 1,760.6 | 1,977.7 | 2,221.5 | 2,495.5 |
| Account Receivables, % | 8.85 | 5.57 | 6.97 | 6.47 | 5.23 | 6.62 | 6.62 | 6.62 | 6.62 | 6.62 |
| Inventories | 2,149.2 | 3,047.0 | 3,285.4 | 3,888.9 | 3,750.3 | 4,379.7 | 4,919.8 | 5,526.5 | 6,208.0 | 6,973.6 |
| Inventories, % | 16.2 | 19.97 | 18.42 | 20.1 | 17.79 | 18.49 | 18.49 | 18.49 | 18.49 | 18.49 |
| Accounts Payable | 772.8 | 1,369.4 | 1,784.9 | 1,860.4 | 2,051.5 | 2,091.1 | 2,348.9 | 2,638.6 | 2,964.0 | 3,329.5 |
| Accounts Payable, % | 5.82 | 8.98 | 10.01 | 9.61 | 9.73 | 8.83 | 8.83 | 8.83 | 8.83 | 8.83 |
| Capital Expenditure | -625.4 | -1,325.4 | -1,130.9 | -933.9 | -967.2 | -1,380.8 | -1,551.1 | -1,742.4 | -1,957.3 | -2,198.7 |
| Capital Expenditure, % | -4.71 | -8.69 | -6.34 | -4.83 | -4.59 | -5.83 | -5.83 | -5.83 | -5.83 | -5.83 |
| Tax Rate, % | 25.31 | 25.31 | 25.31 | 25.31 | 25.31 | 25.31 | 25.31 | 25.31 | 25.31 | 25.31 |
| EBITAT | 3,040.0 | 2,187.1 | 1,971.1 | 3,083.3 | 2,701.6 | 3,636.8 | 4,085.3 | 4,589.1 | 5,155.0 | 5,790.7 |
| Depreciation | ||||||||||
| Changes in Account Receivables | ||||||||||
| Changes in Inventories | ||||||||||
| Changes in Accounts Payable | ||||||||||
| Capital Expenditure | ||||||||||
| UFCF | 242.2 | 1,258.0 | 1,012.9 | 2,011.8 | 2,750.7 | 1,774.3 | 2,701.8 | 3,035.0 | 3,409.3 | 3,829.7 |
| WACC, % | 4.57 | 4.57 | 4.57 | 4.57 | 4.57 | 4.57 | 4.57 | 4.57 | 4.57 | 4.57 |
| PV UFCF | ||||||||||
| SUM PV UFCF | 12,736.5 | |||||||||
| Long Term Growth Rate, % | 3.00 | |||||||||
| Free cash flow (T + 1) | 3,945 | |||||||||
| Terminal Value | 251,484 | |||||||||
| Present Terminal Value | 201,143 | |||||||||
| Enterprise Value | 213,880 | |||||||||
| Net Debt | -316 | |||||||||
| Equity Value | 214,196 | |||||||||
| Diluted Shares Outstanding, MM | 162 | |||||||||
| Equity Value Per Share | 1,318.47 |
What You Will Receive
- Customizable Excel Template: A fully editable Excel DCF Calculator featuring pre-filled financial data for FDC Limited (FDCNS).
- Accurate Data Insights: Access to historical data and forward-looking projections (highlighted in the yellow cells).
- Flexible Forecasting: Modify key assumptions such as revenue growth, EBITDA %, and WACC according to your analysis.
- Instant Calculations: Quickly observe how your inputs affect the valuation of FDC Limited (FDCNS).
- Expert-Grade Tool: Designed for investors, CFOs, consultants, and financial analysts.
- Intuitive Layout: Organized for simplicity and ease of navigation, complete with step-by-step guidelines.
Key Features
- 🔍 Real-Life FDC Financials: Pre-filled historical and projected data for FDC Limited (FDCNS).
- ✏️ Fully Customizable Inputs: Tailor all essential parameters (yellow cells) such as WACC, growth %, and tax rates.
- 📊 Professional DCF Valuation: Integrated formulas compute FDC’s intrinsic value using the Discounted Cash Flow method.
- ⚡ Instant Results: Visualize FDC’s valuation immediately after modifications.
- Scenario Analysis: Evaluate and contrast outcomes for different financial assumptions side-by-side.
How It Functions
- Step 1: Download the ready-made Excel template featuring FDC Limited's (FDCNS) data.
- Step 2: Navigate through the pre-filled spreadsheets to familiarize yourself with the essential metrics.
- Step 3: Update projections and assumptions in the editable yellow cells (WACC, growth, margins).
- Step 4: Instantly see the updated results, including the intrinsic value of FDC Limited (FDCNS).
- Step 5: Utilize the outputs to make informed investment choices or create comprehensive reports.
Why Opt for This Calculator?
- Reliable Data: Utilize authentic FDC Limited financials for trustworthy valuation outcomes.
- Tailorable: Modify essential parameters such as growth rates, WACC, and tax rates to reflect your forecasts.
- Efficiency Boost: Built-in calculations save you the hassle of starting from square one.
- Expert-Level Tool: Crafted for investors, analysts, and consultants in mind.
- Easy to Use: Featuring an intuitive design and clear, step-by-step guidance suitable for all users.
Who Can Benefit from FDC Limited (FDCNS)?
- Finance Students: Master valuation methods and apply them with real-world data.
- Academics: Enhance your curriculum or research with professional valuation models.
- Investors: Validate your hypotheses and analyze valuation metrics for FDC Limited (FDCNS).
- Analysts: Improve efficiency with a customizable, ready-to-use DCF model.
- Small Business Owners: Discover how major public companies like FDC Limited (FDCNS) are evaluated.
Contents of the Template
- Operating and Balance Sheet Data: Pre-filled historical data and forecasts for FDC Limited (FDCNS), covering revenue, EBITDA, EBIT, and capital expenditures.
- WACC Calculation: A dedicated worksheet for calculating the Weighted Average Cost of Capital (WACC), including crucial parameters such as Beta, risk-free rate, and share price.
- DCF Valuation (Unlevered and Levered): Customizable Discounted Cash Flow models that illustrate intrinsic value with comprehensive calculations.
- Financial Statements: Pre-loaded annual and quarterly financial statements to facilitate thorough analysis.
- Key Ratios: A collection of profitability, leverage, and efficiency ratios specifically for FDC Limited (FDCNS).
- Dashboard and Charts: A visual overview of valuation outputs and assumptions, designed for easy result analysis.
Disclaimer
All information, articles, and product details provided on this website are for general informational and educational purposes only. We do not claim any ownership over, nor do we intend to infringe upon, any trademarks, copyrights, logos, brand names, or other intellectual property mentioned or depicted on this site. Such intellectual property remains the property of its respective owners, and any references here are made solely for identification or informational purposes, without implying any affiliation, endorsement, or partnership.
We make no representations or warranties, express or implied, regarding the accuracy, completeness, or suitability of any content or products presented. Nothing on this website should be construed as legal, tax, investment, financial, medical, or other professional advice. In addition, no part of this site—including articles or product references—constitutes a solicitation, recommendation, endorsement, advertisement, or offer to buy or sell any securities, franchises, or other financial instruments, particularly in jurisdictions where such activity would be unlawful.
All content is of a general nature and may not address the specific circumstances of any individual or entity. It is not a substitute for professional advice or services. Any actions you take based on the information provided here are strictly at your own risk. You accept full responsibility for any decisions or outcomes arising from your use of this website and agree to release us from any liability in connection with your use of, or reliance upon, the content or products found herein.