|
Frequenzelektronik, Inc. (FEIM) DCF -Bewertung |
Fully Editable: Tailor To Your Needs In Excel Or Sheets
Professional Design: Trusted, Industry-Standard Templates
Investor-Approved Valuation Models
MAC/PC Compatible, Fully Unlocked
No Expertise Is Needed; Easy To Follow
Frequency Electronics, Inc. (FEIM) Bundle
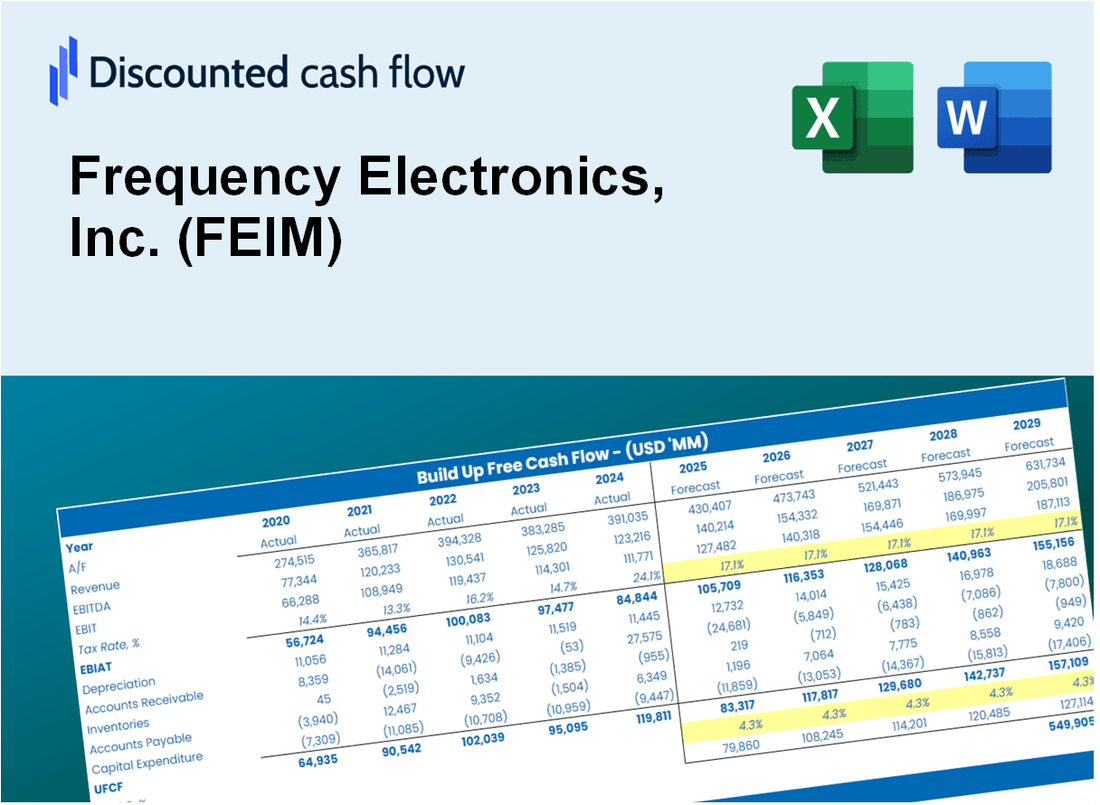
Unabhängig davon, ob Sie ein Investor oder Analyst sind, ist dieser (FEIM) DCF-Taschenrechner Ihre Anlaufstelle für eine genaue Bewertung. Mit realen Daten von Frequency Electronics, Inc., können Sie Prognosen anpassen und die Ergebnisse sofort beobachten.
Discounted Cash Flow (DCF) - (USD MM)
| Year | AY1 2021 |
AY2 2022 |
AY3 2023 |
AY4 2024 |
AY5 2025 |
FY1 2026 |
FY2 2027 |
FY3 2028 |
FY4 2029 |
FY5 2030 |
|---|---|---|---|---|---|---|---|---|---|---|
| Revenue | 54.3 | 48.3 | 40.8 | 55.3 | 69.8 | 76.0 | 82.7 | 90.0 | 97.9 | 106.6 |
| Revenue Growth, % | 0 | -10.98 | -15.57 | 35.55 | 26.3 | 8.83 | 8.83 | 8.83 | 8.83 | 8.83 |
| EBITDA | 3.6 | -5.6 | -2.9 | 7.7 | 14.3 | 3.4 | 3.7 | 4.0 | 4.4 | 4.8 |
| EBITDA, % | 6.68 | -11.55 | -7.05 | 13.93 | 20.49 | 4.5 | 4.5 | 4.5 | 4.5 | 4.5 |
| Depreciation | 3.0 | 3.0 | 2.4 | 2.1 | 2.1 | 3.7 | 4.0 | 4.4 | 4.8 | 5.2 |
| Depreciation, % | 5.57 | 6.23 | 5.87 | 3.84 | 2.94 | 4.89 | 4.89 | 4.89 | 4.89 | 4.89 |
| EBIT | .6 | -8.6 | -5.3 | 5.6 | 12.2 | -.3 | -.3 | -.4 | -.4 | -.4 |
| EBIT, % | 1.11 | -17.78 | -12.93 | 10.08 | 17.54 | -0.39275 | -0.39275 | -0.39275 | -0.39275 | -0.39275 |
| Total Cash | 20.1 | 21.5 | 12.0 | 18.3 | 4.7 | 23.0 | 25.0 | 27.2 | 29.6 | 32.2 |
| Total Cash, percent | .0 | .0 | .0 | .0 | .0 | .0 | .0 | .0 | .0 | .0 |
| Account Receivables | 20.0 | 13.1 | 14.6 | 15.1 | 23.8 | 24.5 | 26.7 | 29.1 | 31.6 | 34.4 |
| Account Receivables, % | 36.82 | 27.22 | 35.88 | 27.39 | 34.13 | 32.29 | 32.29 | 32.29 | 32.29 | 32.29 |
| Inventories | 19.7 | 19.9 | 20.5 | 23.4 | 23.5 | 31.0 | 33.7 | 36.7 | 39.9 | 43.4 |
| Inventories, % | 36.24 | 41.22 | 50.34 | 42.39 | 33.64 | 40.77 | 40.77 | 40.77 | 40.77 | 40.77 |
| Accounts Payable | 1.1 | 1.1 | 1.5 | 2.3 | 1.4 | 2.1 | 2.3 | 2.5 | 2.7 | 3.0 |
| Accounts Payable, % | 1.99 | 2.24 | 3.59 | 4.25 | 1.95 | 2.8 | 2.8 | 2.8 | 2.8 | 2.8 |
| Capital Expenditure | -1.2 | -1.9 | -.9 | -1.5 | -1.8 | -2.1 | -2.3 | -2.5 | -2.7 | -2.9 |
| Capital Expenditure, % | -2.28 | -3.85 | -2.25 | -2.7 | -2.59 | -2.74 | -2.74 | -2.74 | -2.74 | -2.74 |
| Tax Rate, % | -96 | -96 | -96 | -96 | -96 | -96 | -96 | -96 | -96 | -96 |
| EBITAT | .9 | -8.6 | -5.3 | 5.7 | 24.0 | -.3 | -.3 | -.4 | -.4 | -.4 |
| Depreciation | ||||||||||
| Changes in Account Receivables | ||||||||||
| Changes in Inventories | ||||||||||
| Changes in Accounts Payable | ||||||||||
| Capital Expenditure | ||||||||||
| UFCF | -35.9 | -.9 | -5.6 | 3.8 | 14.5 | -6.1 | -3.3 | -3.5 | -3.9 | -4.2 |
| WACC, % | 5.4 | 5.4 | 5.4 | 5.4 | 5.4 | 5.4 | 5.4 | 5.4 | 5.4 | 5.4 |
| PV UFCF | ||||||||||
| SUM PV UFCF | -18.1 | |||||||||
| Long Term Growth Rate, % | 4.00 | |||||||||
| Free cash flow (T + 1) | -4 | |||||||||
| Terminal Value | -312 | |||||||||
| Present Terminal Value | -240 | |||||||||
| Enterprise Value | -258 | |||||||||
| Net Debt | 4 | |||||||||
| Equity Value | -262 | |||||||||
| Diluted Shares Outstanding, MM | 10 | |||||||||
| Equity Value Per Share | -27.30 |
What You Will Get
- Real FEIM Financial Data: Pre-filled with Frequency Electronics, Inc.'s historical and projected data for precise analysis.
- Fully Editable Template: Easily modify key inputs such as revenue growth, WACC, and EBITDA %.
- Automatic Calculations: Watch FEIM's intrinsic value update instantly based on your modifications.
- Professional Valuation Tool: Tailored for investors, analysts, and consultants seeking accurate DCF results.
- User-Friendly Design: Intuitive layout and clear instructions suitable for all experience levels.
Key Features
- Comprehensive Data: Frequency Electronics, Inc. (FEIM) provides detailed historical financial statements and insightful forecasts.
- Customizable Parameters: Adjust WACC, tax rates, revenue growth, and EBITDA margins to fit your analysis.
- Real-Time Analysis: Instantly view the recalculated intrinsic value of Frequency Electronics, Inc. (FEIM).
- Intuitive Visualizations: Dashboard graphics present valuation results and essential metrics clearly.
- Designed for Precision: A reliable tool tailored for analysts, investors, and financial professionals.
How It Works
- 1. Access the Template: Download and open the Excel file containing Frequency Electronics, Inc.'s (FEIM) preloaded financial data.
- 2. Adjust Key Inputs: Modify essential parameters such as growth rates, WACC, and capital expenditures to fit your analysis.
- 3. Analyze Results Immediately: The DCF model automatically computes intrinsic value and NPV based on your inputs.
- 4. Explore Different Scenarios: Evaluate various forecasts to understand how different assumptions affect valuation outcomes.
- 5. Present with Assurance: Share professional valuation insights to reinforce your strategic decisions.
Why Choose This Calculator for Frequency Electronics, Inc. (FEIM)?
- Accurate Data: Real Frequency Electronics financials provide dependable valuation outcomes.
- Customizable: Modify essential parameters like growth rates, WACC, and tax rates to fit your forecasts.
- Time-Saving: Pre-built calculations save you from starting from square one.
- Professional-Grade Tool: Tailored for investors, analysts, and consultants in the field.
- User-Friendly: Intuitive design and step-by-step guidance ensure ease of use for everyone.
Who Should Use This Product?
- Investors: Evaluate Frequency Electronics, Inc. (FEIM)'s valuation before making investment decisions.
- CFOs and Financial Analysts: Enhance valuation methodologies and assess financial forecasts.
- Startup Founders: Understand the valuation strategies of established companies like Frequency Electronics, Inc. (FEIM).
- Consultants: Provide detailed valuation analyses for clients in the tech sector.
- Students and Educators: Utilize real-time data to explore and teach valuation principles.
What the Template Contains
- Comprehensive DCF Model: Editable template featuring detailed valuation calculations.
- Real-World Data: Frequency Electronics, Inc. (FEIM)’s historical and projected financials preloaded for analysis.
- Customizable Parameters: Adjust WACC, growth rates, and tax assumptions to explore various scenarios.
- Financial Statements: Complete annual and quarterly breakdowns for in-depth insights.
- Key Ratios: Integrated analysis for profitability, efficiency, and leverage metrics.
- Dashboard with Visual Outputs: Charts and tables designed for clear, actionable results.
Disclaimer
All information, articles, and product details provided on this website are for general informational and educational purposes only. We do not claim any ownership over, nor do we intend to infringe upon, any trademarks, copyrights, logos, brand names, or other intellectual property mentioned or depicted on this site. Such intellectual property remains the property of its respective owners, and any references here are made solely for identification or informational purposes, without implying any affiliation, endorsement, or partnership.
We make no representations or warranties, express or implied, regarding the accuracy, completeness, or suitability of any content or products presented. Nothing on this website should be construed as legal, tax, investment, financial, medical, or other professional advice. In addition, no part of this site—including articles or product references—constitutes a solicitation, recommendation, endorsement, advertisement, or offer to buy or sell any securities, franchises, or other financial instruments, particularly in jurisdictions where such activity would be unlawful.
All content is of a general nature and may not address the specific circumstances of any individual or entity. It is not a substitute for professional advice or services. Any actions you take based on the information provided here are strictly at your own risk. You accept full responsibility for any decisions or outcomes arising from your use of this website and agree to release us from any liability in connection with your use of, or reliance upon, the content or products found herein.