
|
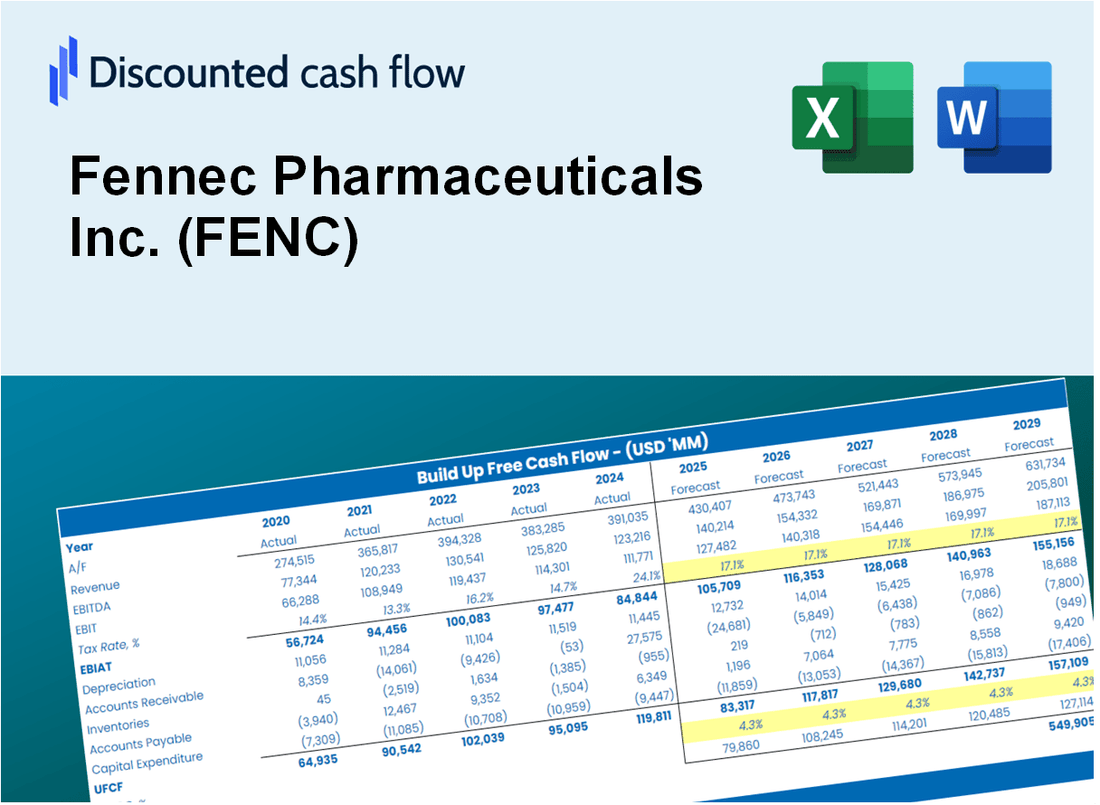
Fennec Pharmaceuticals Inc. (Fenc) DCF -Bewertung |
Fully Editable: Tailor To Your Needs In Excel Or Sheets
Professional Design: Trusted, Industry-Standard Templates
Investor-Approved Valuation Models
MAC/PC Compatible, Fully Unlocked
No Expertise Is Needed; Easy To Follow
Fennec Pharmaceuticals Inc. (FENC) Bundle
Als Anleger oder Analyst ist der DCF-Taschenrechner von FENNEC Pharmaceuticals Inc. (FENC) Ihre Anlaufstelle für eine genaue Bewertung. Es ist mit echten Daten von Fennec Pharmaceuticals Inc. ausgestattet, sodass Sie die Prognosen anpassen und die Auswirkungen in Echtzeit beobachten können.
What You Will Get
- Real FENC Financial Data: Pre-filled with Fennec Pharmaceuticals' historical and projected data for precise analysis.
- Fully Editable Template: Modify key inputs like revenue growth, WACC, and EBITDA % with ease.
- Automatic Calculations: See Fennec Pharmaceuticals' intrinsic value update instantly based on your changes.
- Professional Valuation Tool: Designed for investors, analysts, and consultants seeking accurate DCF results.
- User-Friendly Design: Simple structure and clear instructions for all experience levels.
Key Features
- Customizable Forecast Inputs: Adjust essential parameters such as revenue growth, EBITDA %, and R&D expenditures.
- Instant DCF Valuation: Quickly computes intrinsic value, NPV, and other financial metrics.
- High-Precision Accuracy: Leverages Fennec Pharmaceuticals Inc.'s (FENC) actual financial data for credible valuation results.
- Streamlined Scenario Analysis: Easily evaluate various assumptions and analyze different outcomes.
- Efficiency Booster: Avoid the complexities of constructing detailed valuation models from the ground up.
How It Works
- 1. Access the Template: Download and open the Excel file containing Fennec Pharmaceuticals Inc.'s (FENC) preloaded data.
- 2. Modify Assumptions: Adjust critical inputs such as growth rates, WACC, and capital expenditures.
- 3. View Results in Real-Time: The DCF model automatically computes intrinsic value and NPV.
- 4. Explore Scenarios: Evaluate various forecasts to assess different valuation results.
- 5. Present with Assurance: Deliver professional valuation insights to back your strategic decisions.
Why Choose This Calculator for Fennec Pharmaceuticals Inc. (FENC)?
- Accurate Data: Utilize real financial metrics from Fennec Pharmaceuticals for dependable valuation outcomes.
- Customizable: Tailor critical variables such as growth rates, WACC, and tax rates to align with your forecasts.
- Time-Saving: Pre-configured calculations streamline the process, saving you the effort of starting from the ground up.
- Professional-Grade Tool: Crafted for investors, analysts, and consultants in the pharmaceutical sector.
- User-Friendly: Designed with an intuitive interface and clear instructions, making it accessible for all users.
Who Should Use This Product?
- Pharmaceutical Students: Explore drug development processes and apply them to real-world case studies.
- Researchers: Integrate advanced pharmaceutical models into academic projects or clinical studies.
- Investors: Evaluate your investment strategies and assess the valuation of Fennec Pharmaceuticals Inc. (FENC).
- Market Analysts: Enhance your analysis with a customizable model tailored for pharmaceutical valuations.
- Healthcare Entrepreneurs: Understand how established companies like Fennec Pharmaceuticals Inc. (FENC) navigate the market.
What the Template Contains
- Pre-Filled Data: Includes Fennec Pharmaceuticals' historical financials and forecasts.
- Discounted Cash Flow Model: Editable DCF valuation model with automatic calculations.
- Weighted Average Cost of Capital (WACC): A dedicated sheet for calculating WACC based on custom inputs.
- Key Financial Ratios: Analyze Fennec Pharmaceuticals' profitability, efficiency, and leverage.
- Customizable Inputs: Edit revenue growth, margins, and tax rates with ease.
- Clear Dashboard: Charts and tables summarizing key valuation results.
Disclaimer
All information, articles, and product details provided on this website are for general informational and educational purposes only. We do not claim any ownership over, nor do we intend to infringe upon, any trademarks, copyrights, logos, brand names, or other intellectual property mentioned or depicted on this site. Such intellectual property remains the property of its respective owners, and any references here are made solely for identification or informational purposes, without implying any affiliation, endorsement, or partnership.
We make no representations or warranties, express or implied, regarding the accuracy, completeness, or suitability of any content or products presented. Nothing on this website should be construed as legal, tax, investment, financial, medical, or other professional advice. In addition, no part of this site—including articles or product references—constitutes a solicitation, recommendation, endorsement, advertisement, or offer to buy or sell any securities, franchises, or other financial instruments, particularly in jurisdictions where such activity would be unlawful.
All content is of a general nature and may not address the specific circumstances of any individual or entity. It is not a substitute for professional advice or services. Any actions you take based on the information provided here are strictly at your own risk. You accept full responsibility for any decisions or outcomes arising from your use of this website and agree to release us from any liability in connection with your use of, or reliance upon, the content or products found herein.