
|
Fibrogen, Inc. (FGen) DCF -Bewertung |
Fully Editable: Tailor To Your Needs In Excel Or Sheets
Professional Design: Trusted, Industry-Standard Templates
Investor-Approved Valuation Models
MAC/PC Compatible, Fully Unlocked
No Expertise Is Needed; Easy To Follow
FibroGen, Inc. (FGEN) Bundle
Gewinnen Sie einen Einblick in Ihre Bewertungsanalyse für Fibrogen, Inc. (FGen) mit unserem ausgefeilten DCF -Taschenrechner! Diese Excel-Vorlage mit Echtzeitdaten für (FGen) ermöglicht es Ihnen, Vorhersagen und Annahmen anzupassen und eine genaue Berechnung des intrinsischen Wertes des Fibrogens zu ermöglichen.
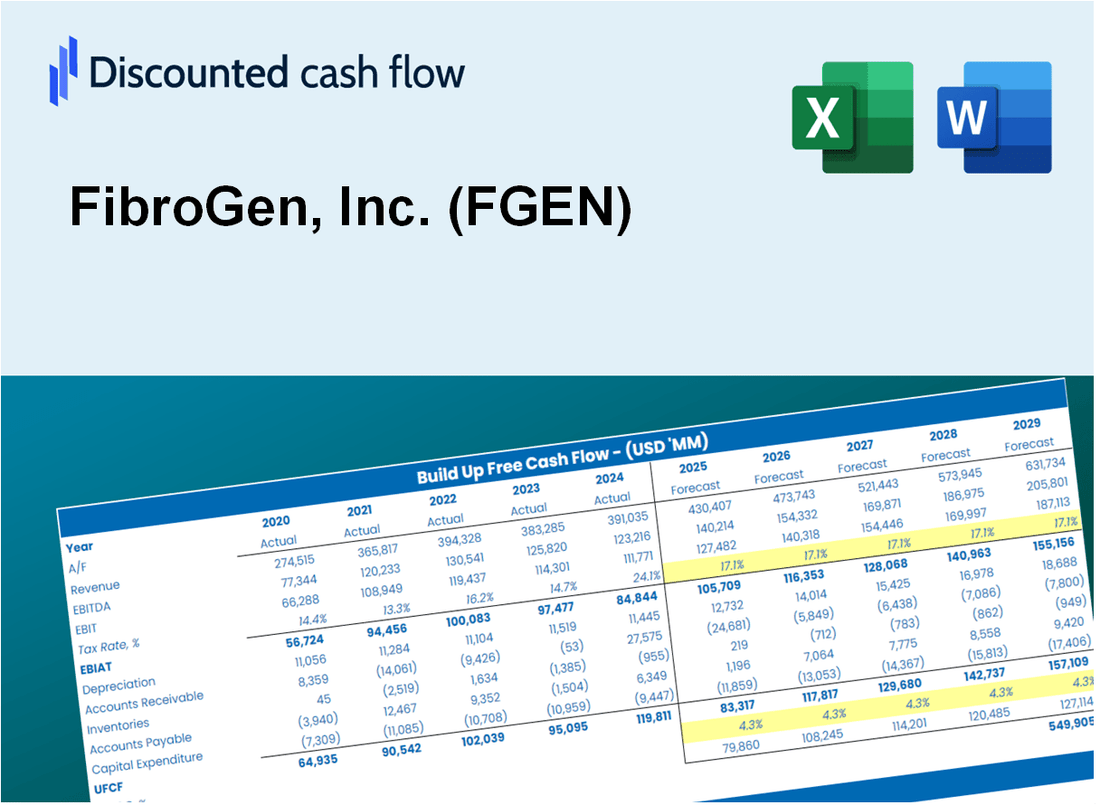
Discounted Cash Flow (DCF) - (USD MM)
| Year | AY1 2020 |
AY2 2021 |
AY3 2022 |
AY4 2023 |
AY5 2024 |
FY1 2025 |
FY2 2026 |
FY3 2027 |
FY4 2028 |
FY5 2029 |
|---|---|---|---|---|---|---|---|---|---|---|
| Revenue | 176.3 | 235.3 | 140.7 | 46.8 | 29.6 | 21.5 | 15.5 | 11.3 | 8.2 | 5.9 |
| Revenue Growth, % | 0 | 33.46 | -40.19 | -66.74 | -36.71 | -27.55 | -27.55 | -27.55 | -27.55 | -27.55 |
| EBITDA | -164.3 | -274.8 | -282.8 | -305.2 | -142.4 | -21.2 | -15.3 | -11.1 | -8.1 | -5.8 |
| EBITDA, % | -93.17 | -116.78 | -200.96 | -652.09 | -480.83 | -98.63 | -98.63 | -98.63 | -98.63 | -98.63 |
| Depreciation | 22.0 | 14.8 | 10.6 | 9.9 | 2.7 | 2.4 | 1.8 | 1.3 | .9 | .7 |
| Depreciation, % | 12.5 | 6.29 | 7.53 | 21.22 | 9.09 | 11.33 | 11.33 | 11.33 | 11.33 | 11.33 |
| EBIT | -186.3 | -289.6 | -293.4 | -315.1 | -145.1 | -21.5 | -15.5 | -11.3 | -8.2 | -5.9 |
| EBIT, % | -105.68 | -123.08 | -208.5 | -673.31 | -489.92 | -100 | -100 | -100 | -100 | -100 |
| Total Cash | 686.5 | 405.2 | 422.0 | 235.6 | 50.5 | 21.5 | 15.5 | 11.3 | 8.2 | 5.9 |
| Total Cash, percent | .0 | .0 | .0 | .0 | .0 | .0 | .0 | .0 | .0 | .0 |
| Account Receivables | 41.9 | 25.4 | 16.3 | 41.1 | 29.0 | 9.9 | 7.2 | 5.2 | 3.8 | 2.7 |
| Account Receivables, % | 23.75 | 10.79 | 11.58 | 87.71 | 97.84 | 46.34 | 46.34 | 46.34 | 46.34 | 46.34 |
| Inventories | 16.5 | 31.0 | 40.4 | 41.6 | 3.2 | 6.5 | 4.7 | 3.4 | 2.5 | 1.8 |
| Inventories, % | 9.38 | 13.18 | 28.73 | 88.81 | 10.65 | 30.15 | 30.15 | 30.15 | 30.15 | 30.15 |
| Accounts Payable | 24.8 | 26.1 | 30.8 | 18.0 | 5.1 | 4.4 | 3.2 | 2.3 | 1.7 | 1.2 |
| Accounts Payable, % | 14.06 | 11.09 | 21.86 | 38.37 | 17.1 | 20.49 | 20.49 | 20.49 | 20.49 | 20.49 |
| Capital Expenditure | -4.0 | -30.2 | -38.7 | -2.5 | -.3 | -2.1 | -1.5 | -1.1 | -.8 | -.6 |
| Capital Expenditure, % | -2.27 | -12.83 | -27.53 | -5.38 | -0.89801 | -9.78 | -9.78 | -9.78 | -9.78 | -9.78 |
| Tax Rate, % | 68.98 | 68.98 | 68.98 | 68.98 | 68.98 | 68.98 | 68.98 | 68.98 | 68.98 | 68.98 |
| EBITAT | -186.7 | -290.0 | -293.8 | -277.1 | -45.0 | -18.0 | -13.0 | -9.4 | -6.8 | -5.0 |
| Depreciation | ||||||||||
| Changes in Account Receivables | ||||||||||
| Changes in Inventories | ||||||||||
| Changes in Accounts Payable | ||||||||||
| Capital Expenditure | ||||||||||
| UFCF | -202.3 | -302.0 | -317.6 | -308.4 | -5.0 | -2.6 | -9.5 | -6.9 | -5.0 | -3.6 |
| WACC, % | 7.57 | 7.57 | 7.57 | 7.49 | 7.11 | 7.46 | 7.46 | 7.46 | 7.46 | 7.46 |
| PV UFCF | ||||||||||
| SUM PV UFCF | -22.4 | |||||||||
| Long Term Growth Rate, % | 2.00 | |||||||||
| Free cash flow (T + 1) | -4 | |||||||||
| Terminal Value | -67 | |||||||||
| Present Terminal Value | -47 | |||||||||
| Enterprise Value | -69 | |||||||||
| Net Debt | 23 | |||||||||
| Equity Value | -92 | |||||||||
| Diluted Shares Outstanding, MM | 100 | |||||||||
| Equity Value Per Share | -0.92 |
What You Will Get
- Editable Excel Template: A fully customizable Excel-based DCF Calculator featuring pre-filled real FibroGen (FGEN) financials.
- Real-World Data: Historical data and forward-looking estimates (as displayed in the highlighted cells).
- Forecast Flexibility: Adjust forecast assumptions such as revenue growth, EBITDA %, and WACC.
- Automatic Calculations: Quickly observe how your inputs affect FibroGen’s valuation.
- Professional Tool: Designed for investors, CFOs, consultants, and financial analysts.
- User-Friendly Design: Organized for clarity and simplicity, complete with step-by-step instructions.
Key Features
- Comprehensive FGEN Data: Pre-filled with FibroGen’s historical financials and future projections.
- Flexible Input Options: Modify revenue growth, profit margins, WACC, tax rates, and capital expenditures as needed.
- Interactive Valuation Model: Automatic recalculations of Net Present Value (NPV) and intrinsic value based on user inputs.
- Scenario Analysis: Develop various forecast scenarios to evaluate different valuation results.
- Intuitive User Interface: Designed to be simple and structured for both professionals and newcomers.
How It Works
- 1. Access the Template: Download and open the Excel file containing FibroGen, Inc.'s (FGEN) preloaded data.
- 2. Modify Assumptions: Adjust key inputs such as growth rates, WACC, and capital expenditures to fit your analysis.
- 3. See Results in Real-Time: The DCF model automatically computes intrinsic value and NPV based on your inputs.
- 4. Explore Scenarios: Evaluate various forecasts to understand different valuation possibilities.
- 5. Present with Assurance: Share professional valuation insights to bolster your decision-making process.
Why Choose This Calculator?
- Accurate Data: Real FibroGen financials ensure reliable valuation results.
- Customizable: Adjust key parameters like growth rates, WACC, and tax rates to match your projections.
- Time-Saving: Pre-built calculations eliminate the need to start from scratch.
- Professional-Grade Tool: Designed for investors, analysts, and consultants.
- User-Friendly: Intuitive layout and step-by-step instructions make it easy for all users.
Who Should Use This Product?
- Investors: Assess FibroGen, Inc.'s (FGEN) valuation prior to making investment decisions.
- CFOs and Financial Analysts: Enhance valuation methodologies and evaluate financial forecasts.
- Startup Founders: Understand the valuation strategies of established biopharmaceutical companies like FibroGen, Inc.
- Consultants: Provide comprehensive valuation analyses and reports for clients in the healthcare sector.
- Students and Educators: Utilize real-time data from FibroGen, Inc. (FGEN) to learn and teach valuation principles.
What the Template Contains
- Pre-Filled Data: Includes FibroGen’s historical financials and forecasts.
- Discounted Cash Flow Model: Editable DCF valuation model with automatic calculations.
- Weighted Average Cost of Capital (WACC): A dedicated sheet for calculating WACC based on custom inputs.
- Key Financial Ratios: Analyze FibroGen’s profitability, efficiency, and leverage.
- Customizable Inputs: Edit revenue growth, margins, and tax rates with ease.
- Clear Dashboard: Charts and tables summarizing key valuation results.
Disclaimer
All information, articles, and product details provided on this website are for general informational and educational purposes only. We do not claim any ownership over, nor do we intend to infringe upon, any trademarks, copyrights, logos, brand names, or other intellectual property mentioned or depicted on this site. Such intellectual property remains the property of its respective owners, and any references here are made solely for identification or informational purposes, without implying any affiliation, endorsement, or partnership.
We make no representations or warranties, express or implied, regarding the accuracy, completeness, or suitability of any content or products presented. Nothing on this website should be construed as legal, tax, investment, financial, medical, or other professional advice. In addition, no part of this site—including articles or product references—constitutes a solicitation, recommendation, endorsement, advertisement, or offer to buy or sell any securities, franchises, or other financial instruments, particularly in jurisdictions where such activity would be unlawful.
All content is of a general nature and may not address the specific circumstances of any individual or entity. It is not a substitute for professional advice or services. Any actions you take based on the information provided here are strictly at your own risk. You accept full responsibility for any decisions or outcomes arising from your use of this website and agree to release us from any liability in connection with your use of, or reliance upon, the content or products found herein.