
|
FGI Industries Ltd. (FGI) DCF -Bewertung |
Fully Editable: Tailor To Your Needs In Excel Or Sheets
Professional Design: Trusted, Industry-Standard Templates
Investor-Approved Valuation Models
MAC/PC Compatible, Fully Unlocked
No Expertise Is Needed; Easy To Follow
FGI Industries Ltd. (FGI) Bundle
Entdecken Sie das wahre Potenzial von FGI Industries Ltd. (FGI) mit unserem DCF-Taschenrechner von Professional Grade! Passen Sie wesentliche Annahmen an, erkunden Sie verschiedene Szenarien und bewerten Sie, wie sich die Anpassungen auf die Bewertung des FGI auswirken - alles innerhalb einer einzigen Excel -Vorlage.
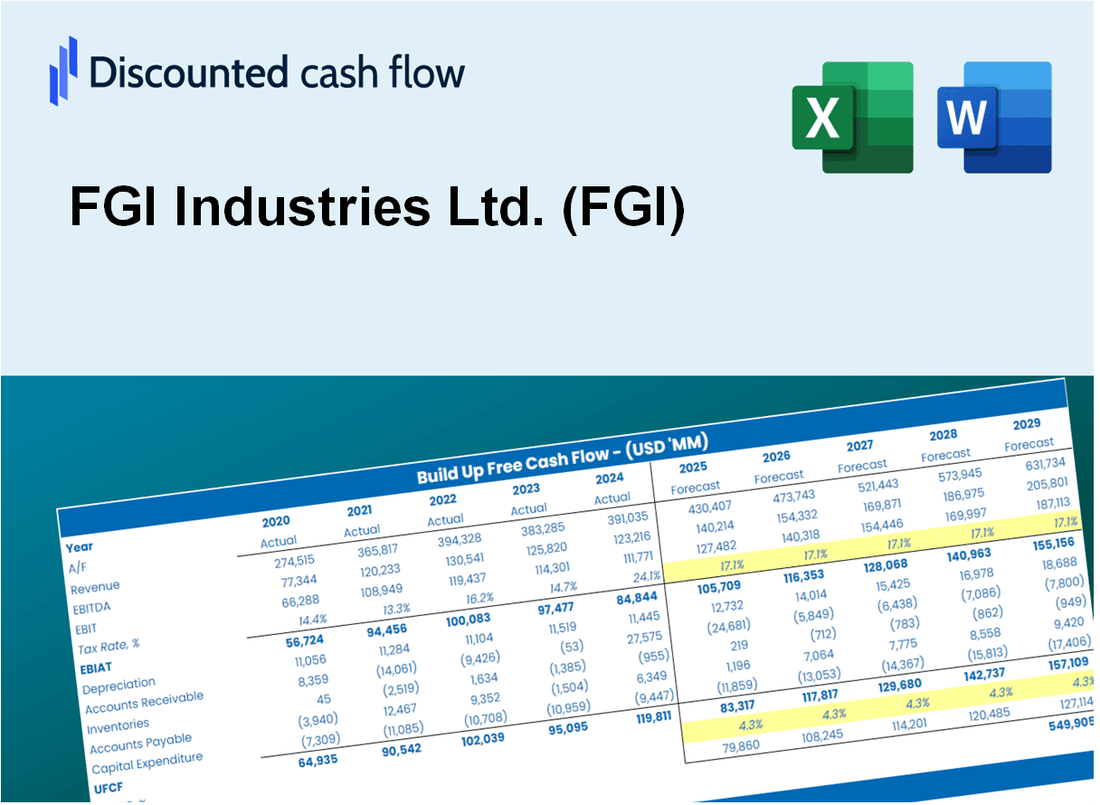
Discounted Cash Flow (DCF) - (USD MM)
| Year | AY1 2020 |
AY2 2021 |
AY3 2022 |
AY4 2023 |
AY5 2024 |
FY1 2025 |
FY2 2026 |
FY3 2027 |
FY4 2028 |
FY5 2029 |
|---|---|---|---|---|---|---|---|---|---|---|
| Revenue | 134.8 | 181.9 | 161.7 | 117.2 | 131.8 | 134.7 | 137.7 | 140.7 | 143.7 | 146.9 |
| Revenue Growth, % | 0 | 34.94 | -11.12 | -27.5 | 12.43 | 2.19 | 2.19 | 2.19 | 2.19 | 2.19 |
| EBITDA | 6.5 | 9.6 | 5.4 | 4.2 | 2.1 | 5.0 | 5.1 | 5.2 | 5.3 | 5.4 |
| EBITDA, % | 4.81 | 5.26 | 3.31 | 3.54 | 1.62 | 3.71 | 3.71 | 3.71 | 3.71 | 3.71 |
| Depreciation | .6 | .3 | .2 | 2.0 | 3.2 | 1.3 | 1.3 | 1.4 | 1.4 | 1.4 |
| Depreciation, % | 0.41594 | 0.15778 | 0.13521 | 1.72 | 2.41 | 0.96789 | 0.96789 | 0.96789 | 0.96789 | 0.96789 |
| EBIT | 5.9 | 9.3 | 5.1 | 2.1 | -1.0 | 3.7 | 3.8 | 3.9 | 3.9 | 4.0 |
| EBIT, % | 4.39 | 5.1 | 3.18 | 1.82 | -0.78545 | 2.74 | 2.74 | 2.74 | 2.74 | 2.74 |
| Total Cash | 4.0 | 3.9 | 10.1 | 7.8 | 4.6 | 5.8 | 5.9 | 6.0 | 6.2 | 6.3 |
| Total Cash, percent | .0 | .0 | .0 | .0 | .0 | .0 | .0 | .0 | .0 | .0 |
| Account Receivables | 17.3 | 26.4 | 14.3 | 23.8 | 20.3 | 19.4 | 19.8 | 20.2 | 20.7 | 21.1 |
| Account Receivables, % | 12.86 | 14.48 | 8.84 | 20.3 | 15.4 | 14.37 | 14.37 | 14.37 | 14.37 | 14.37 |
| Inventories | 8.3 | 21.3 | 13.3 | 9.9 | 14.0 | 12.2 | 12.4 | 12.7 | 13.0 | 13.3 |
| Inventories, % | 6.16 | 11.69 | 8.22 | 8.46 | 10.59 | 9.02 | 9.02 | 9.02 | 9.02 | 9.02 |
| Accounts Payable | 19.5 | 30.8 | 14.8 | 15.3 | 20.2 | 18.6 | 19.0 | 19.4 | 19.8 | 20.3 |
| Accounts Payable, % | 14.47 | 16.92 | 9.17 | 13.02 | 15.36 | 13.79 | 13.79 | 13.79 | 13.79 | 13.79 |
| Capital Expenditure | -.1 | -.1 | -1.1 | -.9 | -2.2 | -.9 | -.9 | -.9 | -.9 | -.9 |
| Capital Expenditure, % | -0.05676282 | -0.03178962 | -0.65807 | -0.80399 | -1.67 | -0.64484 | -0.64484 | -0.64484 | -0.64484 | -0.64484 |
| Tax Rate, % | 47.37 | 47.37 | 47.37 | 47.37 | 47.37 | 47.37 | 47.37 | 47.37 | 47.37 | 47.37 |
| EBITAT | 5.1 | 8.3 | 4.2 | 1.1 | -.5 | 2.7 | 2.7 | 2.8 | 2.9 | 2.9 |
| Depreciation | ||||||||||
| Changes in Account Receivables | ||||||||||
| Changes in Inventories | ||||||||||
| Changes in Accounts Payable | ||||||||||
| Capital Expenditure | ||||||||||
| UFCF | -.6 | -2.2 | 7.4 | -3.5 | 4.9 | 4.2 | 2.9 | 3.0 | 3.0 | 3.1 |
| WACC, % | 8.26 | 8.31 | 8.18 | 7.74 | 7.74 | 8.05 | 8.05 | 8.05 | 8.05 | 8.05 |
| PV UFCF | ||||||||||
| SUM PV UFCF | 13.0 | |||||||||
| Long Term Growth Rate, % | 0.50 | |||||||||
| Free cash flow (T + 1) | 3 | |||||||||
| Terminal Value | 41 | |||||||||
| Present Terminal Value | 28 | |||||||||
| Enterprise Value | 41 | |||||||||
| Net Debt | 23 | |||||||||
| Equity Value | 18 | |||||||||
| Diluted Shares Outstanding, MM | 10 | |||||||||
| Equity Value Per Share | 1.85 |
What You Will Receive
- Customizable Excel Template: A fully adjustable Excel-based DCF Calculator featuring pre-filled real FGI financial data.
- Authentic Data: Historical performance metrics and forward-looking projections (highlighted in the yellow cells).
- Forecast Adaptability: Modify forecast parameters such as revenue growth, EBITDA %, and WACC.
- Instant Calculations: Quickly observe how your inputs affect FGI’s valuation.
- Professional Resource: Designed for investors, CFOs, consultants, and financial analysts.
- User-Friendly Layout: Organized for clarity and ease of navigation, complete with step-by-step guidance.
Key Features
- Comprehensive Data: FGI Industries Ltd.’s (FGI) historical financial records and pre-filled projections.
- Customizable Parameters: Modify WACC, tax rates, revenue growth, and EBITDA margins to fit your analysis.
- Real-Time Insights: Watch FGI’s intrinsic value update instantly as you adjust inputs.
- Intuitive Visualizations: Dashboard graphs illustrate valuation outcomes and essential metrics.
- Designed for Precision: A robust tool tailored for analysts, investors, and finance professionals.
How It Works
- Step 1: Download the Excel file for FGI Industries Ltd. (FGI).
- Step 2: Review pre-entered FGI data (historical and projected).
- Step 3: Adjust key assumptions (yellow cells) based on your analysis.
- Step 4: View automatic recalculations for FGI’s intrinsic value.
- Step 5: Use the outputs for investment decisions or reporting.
Why Choose This Calculator for FGI Industries Ltd. (FGI)?
- Reliable Data: Utilize authentic FGI financials for trustworthy valuation outcomes.
- Flexible Customization: Modify essential parameters such as growth rates, WACC, and tax rates to align with your forecasts.
- Efficient: Built-in calculations save you the hassle of starting from the ground up.
- Professional-Quality Tool: Tailored for investors, analysts, and consultants in the industry.
- Easy to Use: User-friendly design and clear instructions ensure accessibility for all users.
Who Should Use This Product?
- Investors: Evaluate FGI Industries Ltd. (FGI) for informed stock trading decisions.
- CFOs and Financial Analysts: Optimize valuation methodologies and assess financial forecasts.
- Startup Founders: Understand the valuation strategies of established companies like FGI Industries Ltd. (FGI).
- Consultants: Create comprehensive valuation reports to support client needs.
- Students and Educators: Utilize real-time data to enhance learning and application of valuation principles.
What the FGI Template Contains
- Comprehensive DCF Model: Editable template featuring detailed valuation calculations tailored for FGI Industries Ltd. (FGI).
- Real-World Data: FGI’s historical and projected financials preloaded for thorough analysis.
- Customizable Parameters: Modify WACC, growth rates, and tax assumptions to explore various scenarios.
- Financial Statements: Complete annual and quarterly breakdowns for enhanced insights into FGI's performance.
- Key Ratios: Integrated analysis for profitability, efficiency, and leverage specific to FGI.
- Dashboard with Visual Outputs: Charts and tables designed for clear, actionable results regarding FGI's financial health.
Disclaimer
All information, articles, and product details provided on this website are for general informational and educational purposes only. We do not claim any ownership over, nor do we intend to infringe upon, any trademarks, copyrights, logos, brand names, or other intellectual property mentioned or depicted on this site. Such intellectual property remains the property of its respective owners, and any references here are made solely for identification or informational purposes, without implying any affiliation, endorsement, or partnership.
We make no representations or warranties, express or implied, regarding the accuracy, completeness, or suitability of any content or products presented. Nothing on this website should be construed as legal, tax, investment, financial, medical, or other professional advice. In addition, no part of this site—including articles or product references—constitutes a solicitation, recommendation, endorsement, advertisement, or offer to buy or sell any securities, franchises, or other financial instruments, particularly in jurisdictions where such activity would be unlawful.
All content is of a general nature and may not address the specific circumstances of any individual or entity. It is not a substitute for professional advice or services. Any actions you take based on the information provided here are strictly at your own risk. You accept full responsibility for any decisions or outcomes arising from your use of this website and agree to release us from any liability in connection with your use of, or reliance upon, the content or products found herein.