
|
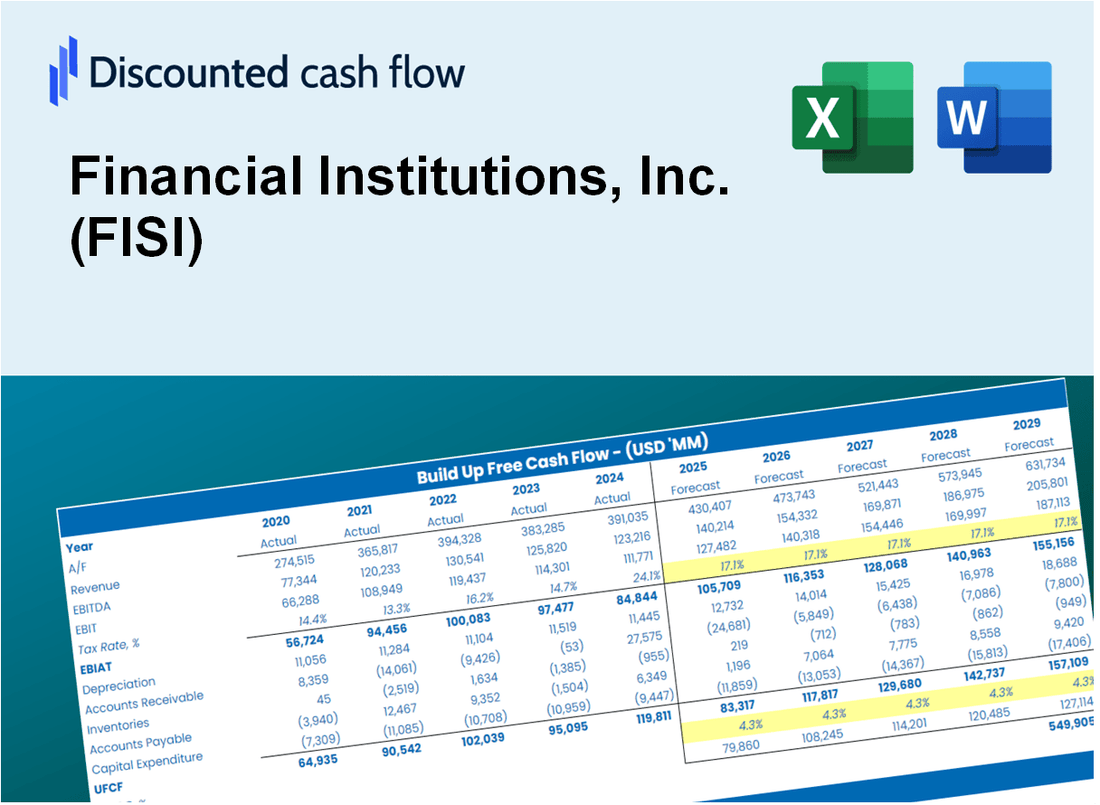
Finanzinstitutionen, Inc. (FISI) DCF -Bewertung |
Fully Editable: Tailor To Your Needs In Excel Or Sheets
Professional Design: Trusted, Industry-Standard Templates
Investor-Approved Valuation Models
MAC/PC Compatible, Fully Unlocked
No Expertise Is Needed; Easy To Follow
Financial Institutions, Inc. (FISI) Bundle
Entdecken Sie den tatsächlichen Wert von Financial Institutions, Inc. (FISI) mit unserem DCF-Taschenrechner für professionelle Qualitätsqualität! Passen Sie die wichtigsten Annahmen an, erkunden Sie verschiedene Szenarien und untersuchen, wie sich Änderungen auf die Bewertung von Financial Institutions, Inc. (FISI) auswirken - alles innerhalb einer einzelnen Excel -Vorlage.
What You Will Get
- Real FISI Data: Preloaded financials – from revenue to EBIT – based on actual and projected figures.
- Full Customization: Adjust all critical parameters (yellow cells) like WACC, growth %, and tax rates.
- Instant Valuation Updates: Automatic recalculations to analyze the impact of changes on FISI’s fair value.
- Versatile Excel Template: Tailored for quick edits, scenario testing, and detailed projections.
- Time-Saving and Accurate: Skip building models from scratch while maintaining precision and flexibility.
Key Features
- Comprehensive FISI Data: Comes pre-loaded with Financial Institutions, Inc.'s historical performance metrics and future forecasts.
- Customizable Financial Inputs: Modify key variables such as loan growth, interest margins, capital ratios, and operational expenses.
- Interactive Valuation Framework: Automatically recalculates Net Present Value (NPV) and intrinsic value in response to your adjustments.
- Flexible Scenario Analysis: Develop various forecasting scenarios to evaluate different valuation possibilities.
- Intuitive User Interface: Designed for ease of use, catering to both experienced professionals and newcomers.
How It Works
- Step 1: Download the Excel file.
- Step 2: Review Financial Institutions, Inc.'s (FISI) pre-filled financial data and forecasts.
- Step 3: Modify key inputs such as revenue growth, WACC, and tax rates (highlighted cells).
- Step 4: Observe the DCF model update in real-time as you adjust your assumptions.
- Step 5: Analyze the outputs and utilize the results for your investment decisions.
Why Choose This Calculator for Financial Institutions, Inc. (FISI)?
- Accuracy: Utilizes real financial data from Financial Institutions, Inc. for precise calculations.
- Flexibility: Allows users to easily adjust and test various input scenarios.
- Time-Saving: Eliminates the need to create a financial model from the ground up.
- Professional-Grade: Crafted with the expertise and standards expected at the CFO level.
- User-Friendly: Designed for ease of use, accommodating those with minimal financial modeling skills.
Who Should Use This Product?
- Investors: Accurately assess the fair value of Financial Institutions, Inc. (FISI) prior to making investment choices.
- CFOs: Utilize a high-quality DCF model for financial reporting and comprehensive analysis.
- Consultants: Efficiently modify the template for client valuation reports.
- Entrepreneurs: Acquire knowledge of financial modeling practices employed by leading financial firms.
- Educators: Implement it as a teaching resource to illustrate valuation techniques.
What the Template Contains
- Pre-Filled Data: Contains Financial Institutions, Inc. (FISI) historical financials and projections.
- Discounted Cash Flow Model: An editable DCF valuation model with automatic computation features.
- Weighted Average Cost of Capital (WACC): A specific sheet for calculating WACC using user-defined inputs.
- Key Financial Ratios: Evaluate Financial Institutions, Inc. (FISI) in terms of profitability, efficiency, and leverage.
- Customizable Inputs: Easily modify revenue growth, profit margins, and tax rates.
- Clear Dashboard: Visual representations and tables summarizing essential valuation outcomes.
Disclaimer
All information, articles, and product details provided on this website are for general informational and educational purposes only. We do not claim any ownership over, nor do we intend to infringe upon, any trademarks, copyrights, logos, brand names, or other intellectual property mentioned or depicted on this site. Such intellectual property remains the property of its respective owners, and any references here are made solely for identification or informational purposes, without implying any affiliation, endorsement, or partnership.
We make no representations or warranties, express or implied, regarding the accuracy, completeness, or suitability of any content or products presented. Nothing on this website should be construed as legal, tax, investment, financial, medical, or other professional advice. In addition, no part of this site—including articles or product references—constitutes a solicitation, recommendation, endorsement, advertisement, or offer to buy or sell any securities, franchises, or other financial instruments, particularly in jurisdictions where such activity would be unlawful.
All content is of a general nature and may not address the specific circumstances of any individual or entity. It is not a substitute for professional advice or services. Any actions you take based on the information provided here are strictly at your own risk. You accept full responsibility for any decisions or outcomes arising from your use of this website and agree to release us from any liability in connection with your use of, or reliance upon, the content or products found herein.