
|
Gujarat Fluorochemicals Limited (Fluorochem.NS) DCF -Bewertung |
Fully Editable: Tailor To Your Needs In Excel Or Sheets
Professional Design: Trusted, Industry-Standard Templates
Investor-Approved Valuation Models
MAC/PC Compatible, Fully Unlocked
No Expertise Is Needed; Easy To Follow
Gujarat Fluorochemicals Limited (FLUOROCHEM.NS) Bundle
Verbessern Sie Ihre Investitionsauswahl mit dem DCF -Taschenrechner (Fluorochemns)! Verwenden Sie authentische Finanzdaten von Gujarat Fluorochemicals Limited, stellen Sie Wachstumsprojektionen und -kosten an und beobachten Sie sofort, wie sich diese Modifikationen auf den inneren Wert von (Fluorochemns) auswirken.
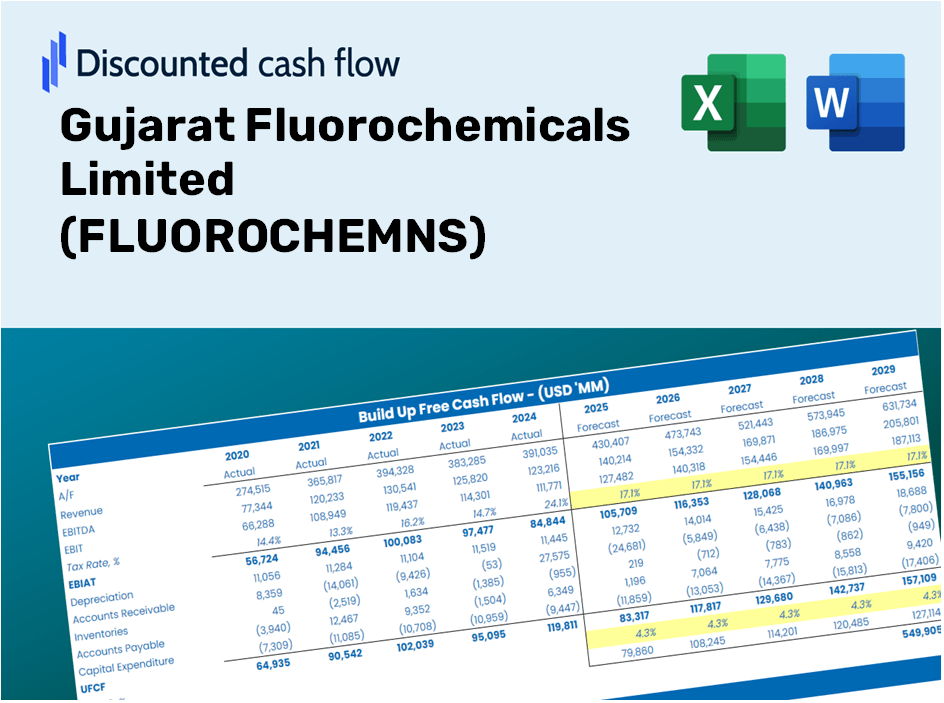
Discounted Cash Flow (DCF) - (USD MM)
| Year | AY1 2021 |
AY2 2022 |
AY3 2023 |
AY4 2024 |
AY5 2025 |
FY1 2026 |
FY2 2027 |
FY3 2028 |
FY4 2029 |
FY5 2030 |
|---|---|---|---|---|---|---|---|---|---|---|
| Revenue | 26,505.0 | 39,535.9 | 56,846.6 | 42,808.2 | 47,374.9 | 56,722.1 | 67,913.6 | 81,313.2 | 97,356.6 | 116,565.5 |
| Revenue Growth, % | 0 | 49.16 | 43.78 | -24.7 | 10.67 | 19.73 | 19.73 | 19.73 | 19.73 | 19.73 |
| EBITDA | 5,952.3 | 11,731.8 | 19,615.6 | 8,945.8 | 10,912.4 | 14,812.3 | 17,734.8 | 21,234.0 | 25,423.5 | 30,439.6 |
| EBITDA, % | 22.46 | 29.67 | 34.51 | 20.9 | 23.03 | 26.11 | 26.11 | 26.11 | 26.11 | 26.11 |
| Depreciation | 1,989.3 | 2,029.3 | 2,323.2 | 2,807.5 | 3,476.5 | 3,473.8 | 4,159.2 | 4,979.9 | 5,962.4 | 7,138.8 |
| Depreciation, % | 7.51 | 5.13 | 4.09 | 6.56 | 7.34 | 6.12 | 6.12 | 6.12 | 6.12 | 6.12 |
| EBIT | 3,963.0 | 9,702.5 | 17,292.4 | 6,138.3 | 7,435.9 | 11,338.5 | 13,575.6 | 16,254.1 | 19,461.1 | 23,300.8 |
| EBIT, % | 14.95 | 24.54 | 30.42 | 14.34 | 15.7 | 19.99 | 19.99 | 19.99 | 19.99 | 19.99 |
| Total Cash | 899.1 | 1,717.5 | 1,611.6 | 1,984.5 | 5,010.0 | 2,924.9 | 3,501.9 | 4,192.9 | 5,020.2 | 6,010.7 |
| Total Cash, percent | .0 | .0 | .0 | .0 | .0 | .0 | .0 | .0 | .0 | .0 |
| Account Receivables | 8,361.8 | 11,241.2 | 14,788.5 | 8,445.9 | 12,240.0 | 14,925.0 | 17,869.7 | 21,395.5 | 25,616.9 | 30,671.2 |
| Account Receivables, % | 31.55 | 28.43 | 26.01 | 19.73 | 25.84 | 26.31 | 26.31 | 26.31 | 26.31 | 26.31 |
| Inventories | 8,639.1 | 9,472.6 | 14,853.8 | 15,713.4 | 18,200.0 | 17,902.3 | 21,434.4 | 25,663.5 | 30,727.0 | 36,789.6 |
| Inventories, % | 32.59 | 23.96 | 26.13 | 36.71 | 38.42 | 31.56 | 31.56 | 31.56 | 31.56 | 31.56 |
| Accounts Payable | 4,318.3 | 5,134.8 | 6,910.0 | 5,189.1 | 6,060.0 | 7,526.9 | 9,012.0 | 10,790.1 | 12,919.1 | 15,468.1 |
| Accounts Payable, % | 16.29 | 12.99 | 12.16 | 12.12 | 12.79 | 13.27 | 13.27 | 13.27 | 13.27 | 13.27 |
| Capital Expenditure | -2,736.7 | -6,740.2 | -7,313.4 | -9,705.6 | -8,300.0 | -9,124.4 | -10,924.7 | -13,080.2 | -15,660.9 | -18,750.9 |
| Capital Expenditure, % | -10.33 | -17.05 | -12.87 | -22.67 | -17.52 | -16.09 | -16.09 | -16.09 | -16.09 | -16.09 |
| Tax Rate, % | 23.41 | 23.41 | 23.41 | 23.41 | 23.41 | 23.41 | 23.41 | 23.41 | 23.41 | 23.41 |
| EBITAT | -1,797.0 | 7,307.5 | 12,874.9 | 4,486.5 | 5,695.4 | 6,790.7 | 8,130.5 | 9,734.7 | 11,655.4 | 13,955.0 |
| Depreciation | ||||||||||
| Changes in Account Receivables | ||||||||||
| Changes in Inventories | ||||||||||
| Changes in Accounts Payable | ||||||||||
| Capital Expenditure | ||||||||||
| UFCF | -15,226.9 | -299.8 | 731.4 | 1,350.6 | -4,538.0 | 219.9 | -3,626.8 | -4,342.3 | -5,199.1 | -6,224.9 |
| WACC, % | 4.45 | 4.68 | 4.68 | 4.67 | 4.68 | 4.63 | 4.63 | 4.63 | 4.63 | 4.63 |
| PV UFCF | ||||||||||
| SUM PV UFCF | -16,195.6 | |||||||||
| Long Term Growth Rate, % | 4.00 | |||||||||
| Free cash flow (T + 1) | -6,474 | |||||||||
| Terminal Value | -1,026,056 | |||||||||
| Present Terminal Value | -818,220 | |||||||||
| Enterprise Value | -834,416 | |||||||||
| Net Debt | 18,580 | |||||||||
| Equity Value | -852,996 | |||||||||
| Diluted Shares Outstanding, MM | 110 | |||||||||
| Equity Value Per Share | -7,765.10 |
What You Will Receive
- Customizable Excel Template: An easily adaptable Excel-based DCF Calculator featuring pre-filled real FLUOROCHEMNS financials.
- Authentic Data: Access to historical data and projections (highlighted in the yellow cells).
- Adaptable Forecasts: Modify forecast parameters such as revenue growth, EBITDA %, and WACC.
- Instant Calculations: Quickly observe how your inputs affect the valuation of Gujarat Fluorochemicals Limited (FLUOROCHEMNS).
- Professional Resource: Designed for investors, CFOs, consultants, and financial analysts.
- User-Centric Layout: Organized for simplicity and usability, complete with step-by-step guidance.
Core Features
- Authentic Financial Data: Gain access to reliable historical figures and future forecasts for Gujarat Fluorochemicals Limited (FLUOROCHEMNS).
- Adjustable Assumptions: Modify highlighted cells to tailor WACC, growth rates, and profit margins to your needs.
- Real-Time Calculations: Enjoy automatic updates for DCF, Net Present Value (NPV), and cash flow evaluations.
- User-Friendly Dashboard: Utilize clear charts and summaries to effectively present your valuation outcomes.
- Designed for All Skill Levels: A straightforward, intuitive layout suitable for investors, CFOs, and consultants alike.
How It Functions
- Download: Obtain the pre-built Excel file featuring Gujarat Fluorochemicals Limited's (FLUOROCHEMNS) financial data.
- Customize: Modify forecasts, including revenue growth, EBITDA %, and WACC as per your analysis.
- Update Automatically: Enjoy real-time updates of intrinsic value and NPV calculations.
- Test Scenarios: Generate various projections and compare results seamlessly.
- Make Decisions: Leverage the valuation outputs to inform your investment choices.
Why Select the FLUOROCHEMNS Calculator?
- Designed for Experts: A sophisticated tool utilized by financial analysts, CFOs, and industry consultants.
- Comprehensive Data: Gujarat Fluorochemicals Limited’s (FLUOROCHEMNS) historical and projected financials integrated for precision.
- Dynamic Scenario Analysis: Effortlessly explore various forecasts and assumptions.
- Insightful Results: Instantly computes intrinsic value, NPV, and essential financial metrics.
- User-Friendly: Simple, step-by-step guidance to navigate the calculator with ease.
Who Should Consider Gujarat Fluorochemicals Limited (FLUOROCHEMNS)?
- Individual Investors: Gain insights to make informed choices about purchasing or selling shares of Gujarat Fluorochemicals (FLUOROCHEMNS).
- Financial Analysts: Enhance valuation workflows with comprehensive financial models tailored for Gujarat Fluorochemicals (FLUOROCHEMNS).
- Consultants: Provide accurate and timely valuation analyses to clients with a focus on Gujarat Fluorochemicals (FLUOROCHEMNS).
- Business Owners: Learn how leading firms like Gujarat Fluorochemicals (FLUOROCHEMNS) are valued to inform your business strategies.
- Finance Students: Explore valuation methodologies using real data and scenarios from Gujarat Fluorochemicals (FLUOROCHEMNS).
Contents of the Template
- Preloaded FLUOROCHEMNS Data: Historical and projected financial data, encompassing revenue, EBIT, and capital expenditures.
- DCF and WACC Models: Advanced sheets designed for calculating intrinsic value and Weighted Average Cost of Capital.
- Editable Inputs: Yellow-highlighted cells for modifying revenue growth, tax rates, and discount rates.
- Financial Statements: Detailed annual and quarterly financial statements for thorough analysis.
- Key Ratios: Metrics on profitability, leverage, and efficiency to assess performance.
- Dashboard and Charts: Visual representations of valuation results and underlying assumptions.
Disclaimer
All information, articles, and product details provided on this website are for general informational and educational purposes only. We do not claim any ownership over, nor do we intend to infringe upon, any trademarks, copyrights, logos, brand names, or other intellectual property mentioned or depicted on this site. Such intellectual property remains the property of its respective owners, and any references here are made solely for identification or informational purposes, without implying any affiliation, endorsement, or partnership.
We make no representations or warranties, express or implied, regarding the accuracy, completeness, or suitability of any content or products presented. Nothing on this website should be construed as legal, tax, investment, financial, medical, or other professional advice. In addition, no part of this site—including articles or product references—constitutes a solicitation, recommendation, endorsement, advertisement, or offer to buy or sell any securities, franchises, or other financial instruments, particularly in jurisdictions where such activity would be unlawful.
All content is of a general nature and may not address the specific circumstances of any individual or entity. It is not a substitute for professional advice or services. Any actions you take based on the information provided here are strictly at your own risk. You accept full responsibility for any decisions or outcomes arising from your use of this website and agree to release us from any liability in connection with your use of, or reliance upon, the content or products found herein.