
|
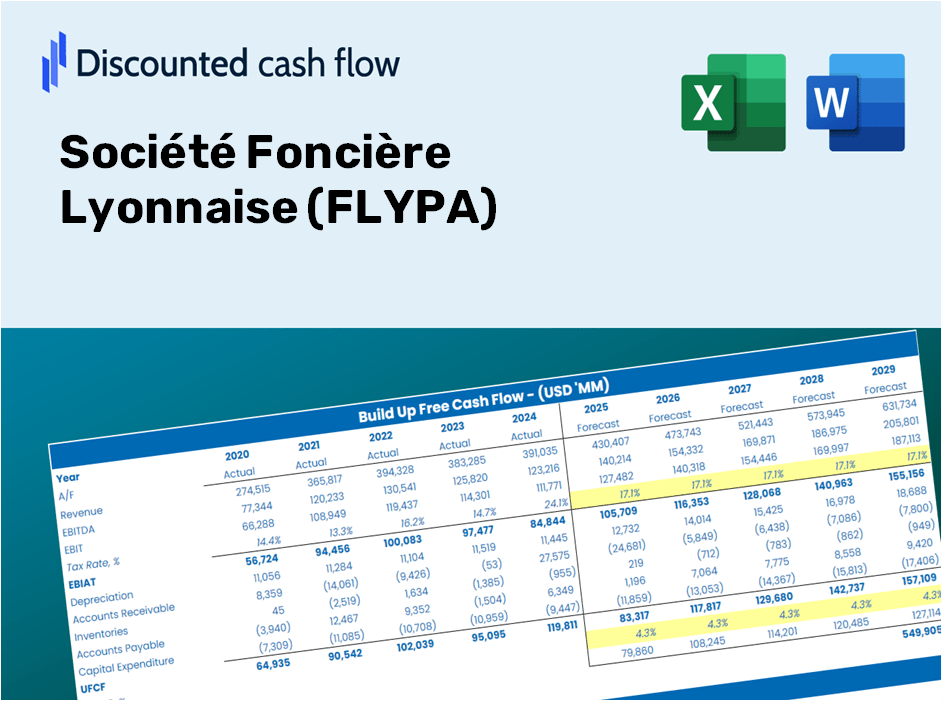
Société Foncière Lyonnaise (Fly.PA) DCF -Bewertung |
Fully Editable: Tailor To Your Needs In Excel Or Sheets
Professional Design: Trusted, Industry-Standard Templates
Investor-Approved Valuation Models
MAC/PC Compatible, Fully Unlocked
No Expertise Is Needed; Easy To Follow
Société Foncière Lyonnaise (FLY.PA) Bundle
Sparen Sie Zeit und verbessern Sie die Präzision mit unserem (FlyPA) DCF -Taschenrechner! Mit echten Daten von Société Foncière Lyonnaise und anpassbaren Annahmen ermöglichen dieses Tool Sie, wie ein erfahrener Investor prognostizieren, analysieren und value (FlyPA).
What You'll Receive
- Authentic FLYPA Financial Data: Pre-populated with Société Foncière Lyonnaise’s historical and forecasted data for accurate analysis.
- Customizable Template: Easily adjust essential inputs like revenue growth, WACC, and EBITDA percentage.
- Instant Calculations: Watch FLYPA’s intrinsic value update in real-time based on your modifications.
- Professional Valuation Tool: Tailored for investors, analysts, and consultants in search of precise DCF outcomes.
- User-Friendly Interface: Streamlined layout and straightforward instructions suitable for all skill levels.
Key Features
- Customizable Valuation Inputs: Adjust essential metrics such as revenue growth, EBITDA %, and capital expenditures for precise forecasting.
- Instant DCF Valuation: Quickly computes intrinsic value, NPV, and other relevant outputs.
- High-Precision Accuracy: Leverages real-world financial data of Société Foncière Lyonnaise (FLYPA) for realistic valuation results.
- Effortless Scenario Analysis: Easily evaluate different assumptions and analyze results side by side.
- Efficiency Boost: Remove the hassle of constructing intricate valuation models from the ground up.
How It Works
- Step 1: Download the prebuilt Excel template that includes data for Société Foncière Lyonnaise (FLYPA).
- Step 2: Navigate through the pre-filled sheets to familiarize yourself with the essential metrics.
- Step 3: Modify forecasts and assumptions in the editable yellow cells (WACC, growth, margins) as needed.
- Step 4: Instantly see updated results, including the intrinsic value of Société Foncière Lyonnaise (FLYPA).
- Step 5: Utilize the outcomes to make informed investment decisions or create detailed reports.
Why Select This Calculator for Société Foncière Lyonnaise (FLYPA)?
- All-in-One Solution: Combines DCF, WACC, and financial ratio analyses in a single platform.
- Flexible Inputs: Modify the yellow-highlighted cells to explore different scenarios.
- In-Depth Analysis: Automatically computes the intrinsic value and Net Present Value for Société Foncière Lyonnaise (FLYPA).
- Pre-Loaded Data: Historical and projected data provide reliable starting points for analysis.
- High-Quality Output: Perfect for financial analysts, investors, and business consultants.
Who Can Benefit from FLYPA?
- Real Estate Students: Master property valuation methods and apply them with real-world examples.
- Researchers: Integrate advanced real estate models into academic studies and projects.
- Investors: Validate your investment strategies and assess valuation results for FLYPA's properties.
- Market Analysts: Enhance your productivity with a ready-to-use, adaptable valuation model.
- Property Owners: Discover how major real estate companies, like FLYPA, conduct their analyses.
Contents of the Template
- Preloaded FLYPA Data: Historical and projected financial information, including revenue, EBIT, and capital expenditures.
- DCF and WACC Models: Advanced spreadsheets designed for calculating intrinsic value and Weighted Average Cost of Capital.
- Editable Inputs: Yellow-highlighted cells for modifying revenue growth, tax rates, and discount rates.
- Financial Statements: Detailed annual and quarterly financial reports for in-depth analysis.
- Key Ratios: Ratios focusing on profitability, leverage, and efficiency to assess performance.
- Dashboard and Charts: Visual representations of valuation results and underlying assumptions.
Disclaimer
All information, articles, and product details provided on this website are for general informational and educational purposes only. We do not claim any ownership over, nor do we intend to infringe upon, any trademarks, copyrights, logos, brand names, or other intellectual property mentioned or depicted on this site. Such intellectual property remains the property of its respective owners, and any references here are made solely for identification or informational purposes, without implying any affiliation, endorsement, or partnership.
We make no representations or warranties, express or implied, regarding the accuracy, completeness, or suitability of any content or products presented. Nothing on this website should be construed as legal, tax, investment, financial, medical, or other professional advice. In addition, no part of this site—including articles or product references—constitutes a solicitation, recommendation, endorsement, advertisement, or offer to buy or sell any securities, franchises, or other financial instruments, particularly in jurisdictions where such activity would be unlawful.
All content is of a general nature and may not address the specific circumstances of any individual or entity. It is not a substitute for professional advice or services. Any actions you take based on the information provided here are strictly at your own risk. You accept full responsibility for any decisions or outcomes arising from your use of this website and agree to release us from any liability in connection with your use of, or reliance upon, the content or products found herein.