
|
Fabrinet (FN) DCF -Bewertung |
Fully Editable: Tailor To Your Needs In Excel Or Sheets
Professional Design: Trusted, Industry-Standard Templates
Investor-Approved Valuation Models
MAC/PC Compatible, Fully Unlocked
No Expertise Is Needed; Easy To Follow
Fabrinet (FN) Bundle
In unserem DCF -Taschenrechner für Genauigkeit, der für die Genauigkeit entwickelt wurde, können Sie die Bewertung von Fabrinet anhand von realistischen Finanzdaten bewerten und vollständige Flexibilität bieten, um alle Schlüsselparameter für erweiterte Projektionen zu ändern.
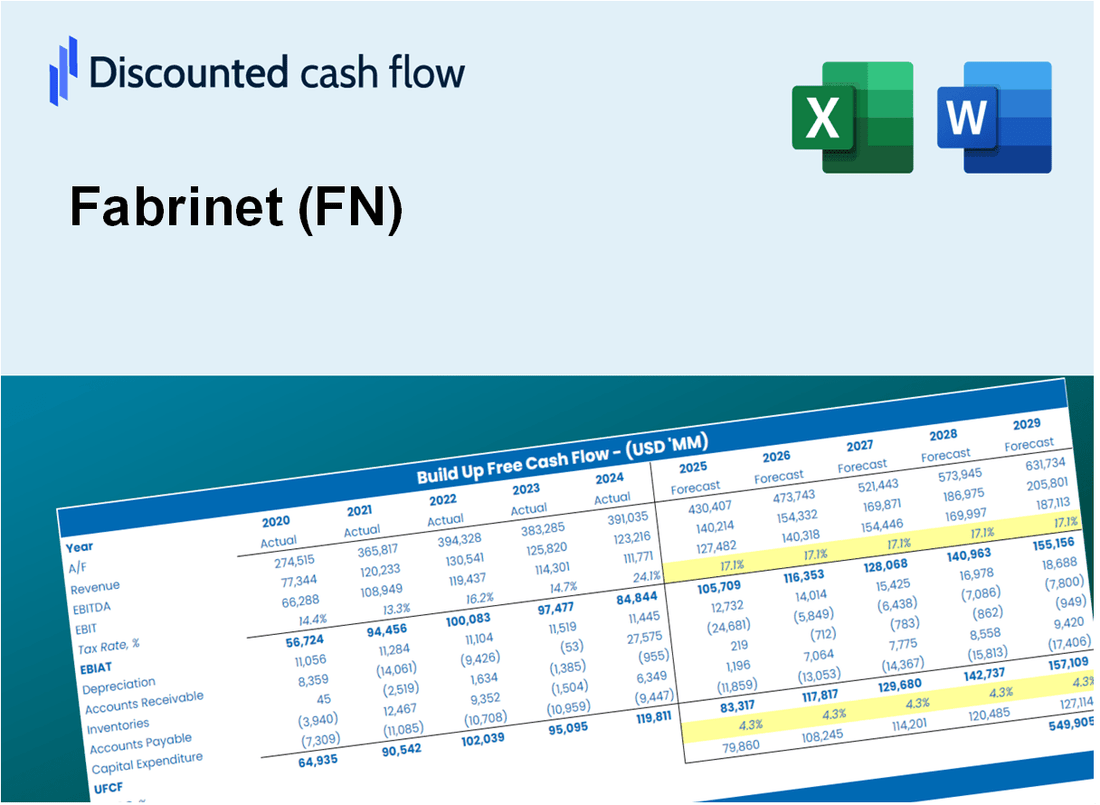
Discounted Cash Flow (DCF) - (USD MM)
| Year | AY1 2021 |
AY2 2022 |
AY3 2023 |
AY4 2024 |
AY5 2025 |
FY1 2026 |
FY2 2027 |
FY3 2028 |
FY4 2029 |
FY5 2030 |
|---|---|---|---|---|---|---|---|---|---|---|
| Revenue | 1,879.4 | 2,262.2 | 2,645.2 | 2,883.0 | 3,419.3 | 3,974.1 | 4,618.8 | 5,368.2 | 6,239.1 | 7,251.3 |
| Revenue Growth, % | 0 | 20.37 | 16.93 | 8.99 | 18.6 | 16.22 | 16.22 | 16.22 | 16.22 | 16.22 |
| EBITDA | 187.8 | 246.1 | 305.4 | 360.5 | 408.6 | 452.0 | 525.4 | 610.6 | 709.7 | 824.8 |
| EBITDA, % | 9.99 | 10.88 | 11.55 | 12.5 | 11.95 | 11.37 | 11.37 | 11.37 | 11.37 | 11.37 |
| Depreciation | 36.3 | 38.7 | 43.8 | 49.0 | 53.4 | 68.0 | 79.1 | 91.9 | 106.8 | 124.2 |
| Depreciation, % | 1.93 | 1.71 | 1.66 | 1.7 | 1.56 | 1.71 | 1.71 | 1.71 | 1.71 | 1.71 |
| EBIT | 151.6 | 207.4 | 261.6 | 311.5 | 355.2 | 384.0 | 446.3 | 518.7 | 602.9 | 700.7 |
| EBIT, % | 8.07 | 9.17 | 9.89 | 10.8 | 10.39 | 9.66 | 9.66 | 9.66 | 9.66 | 9.66 |
| Total Cash | 547.9 | 478.2 | 550.5 | 858.6 | 934.2 | 1,019.0 | 1,184.3 | 1,376.5 | 1,599.8 | 1,859.3 |
| Total Cash, percent | .0 | .0 | .0 | .0 | .0 | .0 | .0 | .0 | .0 | .0 |
| Account Receivables | 348.4 | 452.7 | 531.8 | 592.5 | 758.9 | 805.9 | 936.7 | 1,088.6 | 1,265.2 | 1,470.5 |
| Account Receivables, % | 18.54 | 20.01 | 20.1 | 20.55 | 22.19 | 20.28 | 20.28 | 20.28 | 20.28 | 20.28 |
| Inventories | 422.1 | 557.1 | 519.6 | 463.2 | 581.0 | 793.2 | 921.8 | 1,071.4 | 1,245.2 | 1,447.2 |
| Inventories, % | 22.46 | 24.63 | 19.64 | 16.07 | 16.99 | 19.96 | 19.96 | 19.96 | 19.96 | 19.96 |
| Accounts Payable | 346.6 | 439.7 | 381.1 | 441.8 | 637.4 | 685.5 | 796.8 | 926.0 | 1,076.3 | 1,250.9 |
| Accounts Payable, % | 18.44 | 19.44 | 14.41 | 15.33 | 18.64 | 17.25 | 17.25 | 17.25 | 17.25 | 17.25 |
| Capital Expenditure | -48.0 | -90.6 | -62.3 | -47.5 | -121.8 | -112.2 | -130.5 | -151.6 | -176.2 | -204.8 |
| Capital Expenditure, % | -2.55 | -4 | -2.35 | -1.65 | -3.56 | -2.82 | -2.82 | -2.82 | -2.82 | -2.82 |
| Tax Rate, % | 6.38 | 6.38 | 6.38 | 6.38 | 6.38 | 6.38 | 6.38 | 6.38 | 6.38 | 6.38 |
| EBITAT | 149.4 | 200.8 | 249.3 | 296.3 | 332.5 | 368.2 | 428.0 | 497.4 | 578.1 | 671.9 |
| Depreciation | ||||||||||
| Changes in Account Receivables | ||||||||||
| Changes in Inventories | ||||||||||
| Changes in Accounts Payable | ||||||||||
| Capital Expenditure | ||||||||||
| UFCF | -286.3 | 2.8 | 130.8 | 354.2 | 175.5 | 113.0 | 228.4 | 265.4 | 308.5 | 358.6 |
| WACC, % | 8.69 | 8.69 | 8.69 | 8.69 | 8.69 | 8.69 | 8.69 | 8.69 | 8.69 | 8.69 |
| PV UFCF | ||||||||||
| SUM PV UFCF | 961.3 | |||||||||
| Long Term Growth Rate, % | 3.00 | |||||||||
| Free cash flow (T + 1) | 369 | |||||||||
| Terminal Value | 6,486 | |||||||||
| Present Terminal Value | 4,275 | |||||||||
| Enterprise Value | 5,236 | |||||||||
| Net Debt | -301 | |||||||||
| Equity Value | 5,537 | |||||||||
| Diluted Shares Outstanding, MM | 36 | |||||||||
| Equity Value Per Share | 152.68 |
What You Will Get
- Editable Forecast Inputs: Effortlessly adjust key assumptions (growth %, margins, WACC) to explore various scenarios.
- Real-World Data: Fabrinet’s financial data pre-loaded to facilitate your analysis.
- Automatic DCF Outputs: The template computes Net Present Value (NPV) and intrinsic value automatically.
- Customizable and Professional: A refined Excel model tailored to meet your valuation requirements.
- Built for Analysts and Investors: Perfect for evaluating projections, confirming strategies, and enhancing efficiency.
Key Features
- Comprehensive Financial Data: Fabrinet’s historical financial statements and pre-populated projections.
- Customizable Parameters: Adjust WACC, tax rates, revenue growth, and EBITDA margins as needed.
- Real-Time Valuation: Witness Fabrinet’s intrinsic value update instantly.
- Intuitive Visualizations: Dashboard graphs showcase valuation outcomes and essential metrics.
- Designed for Precision: A robust tool tailored for analysts, investors, and finance professionals.
How It Works
- Download: Get the pre-prepared Excel file containing Fabrinet’s financial data.
- Customize: Modify projections such as revenue growth, EBITDA %, and WACC.
- Update Automatically: The intrinsic value and NPV calculations refresh in real-time.
- Test Scenarios: Generate various forecasts and instantly compare results.
- Make Decisions: Leverage the valuation findings to shape your investment approach.
Why Choose This Calculator for Fabrinet (FN)?
- Accurate Data: Utilizes real Fabrinet financials for trustworthy valuation outcomes.
- Customizable: Modify essential parameters such as growth rates, WACC, and tax rates to fit your forecasts.
- Time-Saving: Pre-configured calculations save you the hassle of starting from the ground up.
- Professional-Grade Tool: Tailored for investors, analysts, and consultants in the industry.
- User-Friendly: An intuitive design and clear step-by-step guidance make it accessible for everyone.
Who Should Use Fabrinet (FN)?
- Investors: Gain insights and make informed decisions with a comprehensive analysis of Fabrinet (FN).
- Financial Analysts: Utilize detailed reports and data to enhance your financial assessments of Fabrinet (FN).
- Consultants: Tailor your strategies and presentations using Fabrinet (FN) as a case study for clients.
- Finance Enthusiasts: Explore the dynamics of the market and learn about Fabrinet (FN) through in-depth research.
- Educators and Students: Incorporate Fabrinet (FN) into your curriculum for hands-on experience with real market scenarios.
What the Template Contains
- Historical Data: Includes Fabrinet’s past financials and baseline forecasts.
- DCF and Levered DCF Models: Detailed templates to calculate Fabrinet’s intrinsic value.
- WACC Sheet: Pre-built calculations for Weighted Average Cost of Capital.
- Editable Inputs: Modify key drivers like growth rates, EBITDA %, and CAPEX assumptions.
- Quarterly and Annual Statements: A complete breakdown of Fabrinet’s financials.
- Interactive Dashboard: Visualize valuation results and projections dynamically.
Disclaimer
All information, articles, and product details provided on this website are for general informational and educational purposes only. We do not claim any ownership over, nor do we intend to infringe upon, any trademarks, copyrights, logos, brand names, or other intellectual property mentioned or depicted on this site. Such intellectual property remains the property of its respective owners, and any references here are made solely for identification or informational purposes, without implying any affiliation, endorsement, or partnership.
We make no representations or warranties, express or implied, regarding the accuracy, completeness, or suitability of any content or products presented. Nothing on this website should be construed as legal, tax, investment, financial, medical, or other professional advice. In addition, no part of this site—including articles or product references—constitutes a solicitation, recommendation, endorsement, advertisement, or offer to buy or sell any securities, franchises, or other financial instruments, particularly in jurisdictions where such activity would be unlawful.
All content is of a general nature and may not address the specific circumstances of any individual or entity. It is not a substitute for professional advice or services. Any actions you take based on the information provided here are strictly at your own risk. You accept full responsibility for any decisions or outcomes arising from your use of this website and agree to release us from any liability in connection with your use of, or reliance upon, the content or products found herein.