
|
Frey SA (Frey.Pa) DCF -Bewertung |
Fully Editable: Tailor To Your Needs In Excel Or Sheets
Professional Design: Trusted, Industry-Standard Templates
Investor-Approved Valuation Models
MAC/PC Compatible, Fully Unlocked
No Expertise Is Needed; Easy To Follow
Frey SA (FREY.PA) Bundle
Vereinfachen Sie die Bewertung der Frey SA (Freypa) mit diesem anpassbaren DCF -Taschenrechner! Mit Real Frey SA (Freypa) -Fonds und einstellbaren Prognoseeingaben können Sie Szenarien testen und Frey SA (Freypa) in Minuten aufdecken.
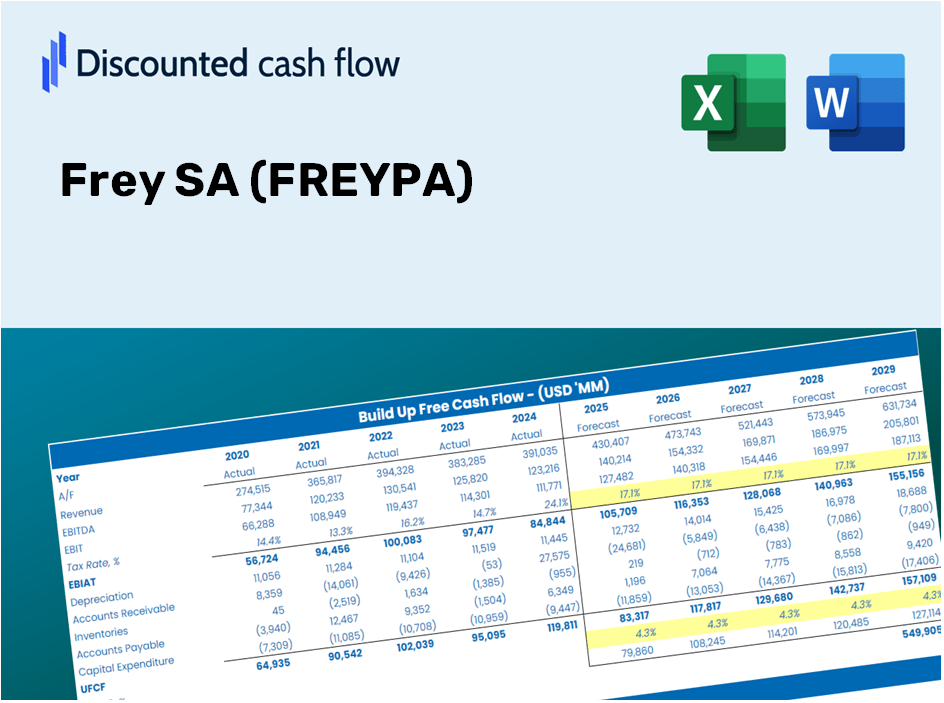
Discounted Cash Flow (DCF) - (USD MM)
| Year | AY1 2020 |
AY2 2021 |
AY3 2022 |
AY4 2023 |
AY5 2024 |
FY1 2025 |
FY2 2026 |
FY3 2027 |
FY4 2028 |
FY5 2029 |
|---|---|---|---|---|---|---|---|---|---|---|
| Revenue | 107.2 | 101.2 | 127.3 | 149.7 | 191.3 | 222.7 | 259.2 | 301.7 | 351.1 | 408.7 |
| Revenue Growth, % | 0 | -5.6 | 25.81 | 17.55 | 27.81 | 16.39 | 16.39 | 16.39 | 16.39 | 16.39 |
| EBITDA | 34.7 | 50.5 | 58.0 | 86.1 | 124.8 | 111.6 | 129.8 | 151.1 | 175.9 | 204.7 |
| EBITDA, % | 32.34 | 49.87 | 45.52 | 57.53 | 65.23 | 50.1 | 50.1 | 50.1 | 50.1 | 50.1 |
| Depreciation | 1.7 | 1.6 | 1.7 | 1.6 | 1.6 | 2.9 | 3.3 | 3.9 | 4.5 | 5.3 |
| Depreciation, % | 1.6 | 1.59 | 1.35 | 1.09 | 0.81281 | 1.29 | 1.29 | 1.29 | 1.29 | 1.29 |
| EBIT | 33.0 | 48.9 | 56.3 | 84.5 | 123.2 | 108.7 | 126.5 | 147.2 | 171.4 | 199.5 |
| EBIT, % | 30.74 | 48.27 | 44.17 | 56.45 | 64.42 | 48.81 | 48.81 | 48.81 | 48.81 | 48.81 |
| Total Cash | 56.2 | 84.5 | 72.1 | 73.0 | 321.3 | 151.9 | 176.8 | 205.8 | 239.6 | 278.9 |
| Total Cash, percent | .0 | .0 | .0 | .0 | .0 | .0 | .0 | .0 | .0 | .0 |
| Account Receivables | 46.0 | 45.6 | 35.9 | 55.7 | 36.7 | 76.8 | 89.4 | 104.1 | 121.1 | 141.0 |
| Account Receivables, % | 42.87 | 45.09 | 28.19 | 37.18 | 19.17 | 34.5 | 34.5 | 34.5 | 34.5 | 34.5 |
| Inventories | 43.0 | 36.8 | 51.6 | 63.2 | 64.0 | 85.8 | 99.8 | 116.2 | 135.3 | 157.4 |
| Inventories, % | 40.1 | 36.31 | 40.5 | 42.25 | 33.47 | 38.53 | 38.53 | 38.53 | 38.53 | 38.53 |
| Accounts Payable | 9.4 | 5.7 | 10.2 | 15.3 | 16.0 | 18.3 | 21.3 | 24.8 | 28.9 | 33.6 |
| Accounts Payable, % | 8.81 | 5.65 | 8.04 | 10.24 | 8.37 | 8.22 | 8.22 | 8.22 | 8.22 | 8.22 |
| Capital Expenditure | -6.1 | -25.6 | -17.8 | -3.5 | -50.0 | -32.7 | -38.1 | -44.3 | -51.6 | -60.0 |
| Capital Expenditure, % | -5.73 | -25.28 | -13.97 | -2.34 | -26.15 | -14.69 | -14.69 | -14.69 | -14.69 | -14.69 |
| Tax Rate, % | 34.27 | 34.27 | 34.27 | 34.27 | 34.27 | 34.27 | 34.27 | 34.27 | 34.27 | 34.27 |
| EBITAT | 34.0 | 42.1 | 50.0 | 52.2 | 81.0 | 87.5 | 101.9 | 118.6 | 138.0 | 160.6 |
| Depreciation | ||||||||||
| Changes in Account Receivables | ||||||||||
| Changes in Inventories | ||||||||||
| Changes in Accounts Payable | ||||||||||
| Capital Expenditure | ||||||||||
| UFCF | -50.0 | 21.0 | 33.4 | 24.0 | 51.4 | -1.9 | 43.5 | 50.6 | 58.9 | 68.5 |
| WACC, % | 4.81 | 4.42 | 4.49 | 3.71 | 3.82 | 4.25 | 4.25 | 4.25 | 4.25 | 4.25 |
| PV UFCF | ||||||||||
| SUM PV UFCF | 188.3 | |||||||||
| Long Term Growth Rate, % | 4.00 | |||||||||
| Free cash flow (T + 1) | 71 | |||||||||
| Terminal Value | 28,302 | |||||||||
| Present Terminal Value | 22,982 | |||||||||
| Enterprise Value | 23,171 | |||||||||
| Net Debt | 916 | |||||||||
| Equity Value | 22,255 | |||||||||
| Diluted Shares Outstanding, MM | 32 | |||||||||
| Equity Value Per Share | 697.89 |
What You Will Receive
- Flexible Forecast Inputs: Easily adjust key assumptions (growth %, margins, WACC) to generate various scenarios.
- Comprehensive Data: Frey SA’s (FREYPA) financial information pre-loaded to kickstart your analysis.
- Automated DCF Results: The model computes Net Present Value (NPV) and intrinsic value automatically for you.
- Customizable and Professional Design: A refined Excel model tailored to meet your valuation requirements.
- Designed for Analysts and Investors: Perfect for evaluating projections, validating strategies, and enhancing efficiency.
Key Features
- Authentic Frey Financials: Gain access to precise pre-loaded historical data along with future forecasts.
- Tailorable Forecast Assumptions: Modify the highlighted cells (in yellow) for parameters like WACC, growth rates, and margins.
- Instantaneous Calculations: Automatic updates for DCF, Net Present Value (NPV), and cash flow analyses.
- Intuitive Dashboard: Clear charts and summaries designed to help you visualize your valuation findings.
- Suitable for All Levels: A user-friendly layout tailored for investors, CFOs, and consultants alike.
How It Functions
- Step 1: Download the Excel spreadsheet.
- Step 2: Examine the pre-filled Frey SA (FREYPA) data (both historical and forecasted).
- Step 3: Modify the key assumptions (highlighted in yellow) according to your analysis.
- Step 4: Observe the automatic updates reflecting Frey SA’s (FREYPA) intrinsic value.
- Step 5: Utilize the results for your investment strategies or reporting purposes.
Why Choose This Calculator for Frey SA (FREYPA)?
- Reliable Data: Accurate financial metrics from Frey SA ensure trustworthy valuation outcomes.
- Flexible Options: Tailor essential inputs such as growth rates, WACC, and tax rates to align with your forecasts.
- Efficiency Boost: Pre-configured calculations allow you to save time and avoid starting from scratch.
- Expert-Level Tool: Crafted for use by investors, analysts, and consultants in the field.
- Simple to Use: An intuitive design and guided instructions make it accessible for all users.
Who Can Benefit from This Product?
- Investors: Accurately assess the fair value of Frey SA (FREYPA) prior to making investment choices.
- CFOs: Utilize a high-quality DCF model for comprehensive financial reporting and analysis.
- Consultants: Effortlessly modify the template for valuation reports tailored to clients.
- Entrepreneurs: Acquire insights into financial modeling techniques employed by industry leaders.
- Educators: Implement it as an educational resource to illustrate valuation methodologies.
Overview of the Template's Features
- Pre-Filled DCF Model: Frey SA’s (FREYPA) financial data included for quick access.
- WACC Calculator: Comprehensive calculations for the Weighted Average Cost of Capital.
- Financial Ratios: Assess Frey SA’s profitability, leverage, and operational efficiency.
- Editable Inputs: Adjust assumptions like growth rates, margins, and capital expenditures to suit your analysis.
- Financial Statements: Annual and quarterly reports to aid in extensive evaluation.
- Interactive Dashboard: Effortlessly visualize essential valuation metrics and outcomes.
Disclaimer
All information, articles, and product details provided on this website are for general informational and educational purposes only. We do not claim any ownership over, nor do we intend to infringe upon, any trademarks, copyrights, logos, brand names, or other intellectual property mentioned or depicted on this site. Such intellectual property remains the property of its respective owners, and any references here are made solely for identification or informational purposes, without implying any affiliation, endorsement, or partnership.
We make no representations or warranties, express or implied, regarding the accuracy, completeness, or suitability of any content or products presented. Nothing on this website should be construed as legal, tax, investment, financial, medical, or other professional advice. In addition, no part of this site—including articles or product references—constitutes a solicitation, recommendation, endorsement, advertisement, or offer to buy or sell any securities, franchises, or other financial instruments, particularly in jurisdictions where such activity would be unlawful.
All content is of a general nature and may not address the specific circumstances of any individual or entity. It is not a substitute for professional advice or services. Any actions you take based on the information provided here are strictly at your own risk. You accept full responsibility for any decisions or outcomes arising from your use of this website and agree to release us from any liability in connection with your use of, or reliance upon, the content or products found herein.