
|
L.B. Foster Company (FSTR) DCF -Bewertung |
Fully Editable: Tailor To Your Needs In Excel Or Sheets
Professional Design: Trusted, Industry-Standard Templates
Investor-Approved Valuation Models
MAC/PC Compatible, Fully Unlocked
No Expertise Is Needed; Easy To Follow
L.B. Foster Company (FSTR) Bundle
Ich möchte den inneren Wert von L.B. Foster Company? Unser (FSTR) DCF-Taschenrechner integriert reale Daten mit umfassenden Anpassungsfunktionen, sodass Sie Ihre Prognosen verfeinern und Ihre Anlageentscheidungen verbessern können.
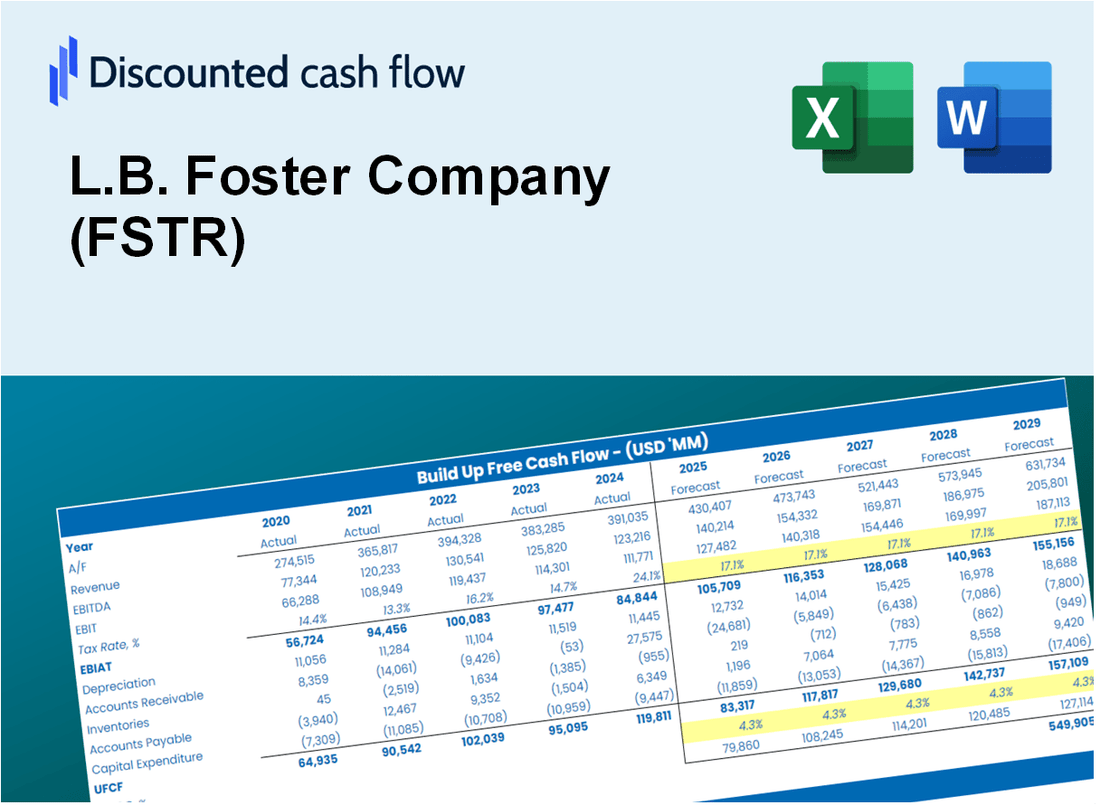
Discounted Cash Flow (DCF) - (USD MM)
| Year | AY1 2020 |
AY2 2021 |
AY3 2022 |
AY4 2023 |
AY5 2024 |
FY1 2025 |
FY2 2026 |
FY3 2027 |
FY4 2028 |
FY5 2029 |
|---|---|---|---|---|---|---|---|---|---|---|
| Revenue | 497.4 | 513.6 | 497.5 | 543.7 | 530.8 | 540.1 | 549.6 | 559.2 | 569.1 | 579.1 |
| Revenue Growth, % | 0 | 3.26 | -3.14 | 9.3 | -2.39 | 1.76 | 1.76 | 1.76 | 1.76 | 1.76 |
| EBITDA | 31.3 | 21.4 | 9.1 | 21.7 | 33.5 | 24.4 | 24.9 | 25.3 | 25.7 | 26.2 |
| EBITDA, % | 6.3 | 4.17 | 1.83 | 4 | 6.31 | 4.52 | 4.52 | 4.52 | 4.52 | 4.52 |
| Depreciation | 13.6 | 13.9 | 14.8 | 15.3 | 14.1 | 15.0 | 15.2 | 15.5 | 15.8 | 16.1 |
| Depreciation, % | 2.73 | 2.7 | 2.97 | 2.81 | 2.65 | 2.77 | 2.77 | 2.77 | 2.77 | 2.77 |
| EBIT | 17.7 | 7.5 | -5.7 | 6.5 | 19.4 | 9.5 | 9.6 | 9.8 | 10.0 | 10.1 |
| EBIT, % | 3.57 | 1.47 | -1.14 | 1.19 | 3.66 | 1.75 | 1.75 | 1.75 | 1.75 | 1.75 |
| Total Cash | 7.6 | 10.4 | 2.9 | 2.6 | 2.5 | 5.5 | 5.6 | 5.7 | 5.8 | 5.9 |
| Total Cash, percent | .0 | .0 | .0 | .0 | .0 | .0 | .0 | .0 | .0 | .0 |
| Account Receivables | 96.1 | 92.1 | 116.1 | 83.0 | 81.7 | 98.6 | 100.3 | 102.1 | 103.8 | 105.7 |
| Account Receivables, % | 19.33 | 17.93 | 23.33 | 15.26 | 15.39 | 18.25 | 18.25 | 18.25 | 18.25 | 18.25 |
| Inventories | 78.6 | 62.9 | 75.7 | 73.1 | 70.5 | 75.6 | 76.9 | 78.3 | 79.7 | 81.1 |
| Inventories, % | 15.81 | 12.24 | 15.22 | 13.45 | 13.28 | 14 | 14 | 14 | 14 | 14 |
| Accounts Payable | 54.8 | 41.4 | 48.8 | 39.5 | 50.1 | 49.2 | 50.1 | 51.0 | 51.9 | 52.8 |
| Accounts Payable, % | 11.01 | 8.06 | 9.81 | 7.26 | 9.44 | 9.12 | 9.12 | 9.12 | 9.12 | 9.12 |
| Capital Expenditure | -9.2 | -4.6 | -7.6 | -4.5 | -9.8 | -7.5 | -7.6 | -7.8 | -7.9 | -8.1 |
| Capital Expenditure, % | -1.85 | -0.8995 | -1.53 | -0.82999 | -1.84 | -1.39 | -1.39 | -1.39 | -1.39 | -1.39 |
| Tax Rate, % | -197.31 | -197.31 | -197.31 | -197.31 | -197.31 | -197.31 | -197.31 | -197.31 | -197.31 | -197.31 |
| EBITAT | 9.6 | 6.0 | -28.6 | 10.0 | 57.8 | 8.2 | 8.3 | 8.5 | 8.6 | 8.8 |
| Depreciation | ||||||||||
| Changes in Account Receivables | ||||||||||
| Changes in Inventories | ||||||||||
| Changes in Accounts Payable | ||||||||||
| Capital Expenditure | ||||||||||
| UFCF | -105.9 | 21.6 | -51.0 | 47.2 | 76.5 | -7.2 | 13.7 | 14.0 | 14.2 | 14.5 |
| WACC, % | 7.75 | 8.1 | 8.39 | 8.39 | 8.39 | 8.2 | 8.2 | 8.2 | 8.2 | 8.2 |
| PV UFCF | ||||||||||
| SUM PV UFCF | 36.3 | |||||||||
| Long Term Growth Rate, % | 3.50 | |||||||||
| Free cash flow (T + 1) | 15 | |||||||||
| Terminal Value | 318 | |||||||||
| Present Terminal Value | 215 | |||||||||
| Enterprise Value | 251 | |||||||||
| Net Debt | 59 | |||||||||
| Equity Value | 192 | |||||||||
| Diluted Shares Outstanding, MM | 11 | |||||||||
| Equity Value Per Share | 17.36 |
What You Will Receive
- Authentic FSTR Financial Data: Pre-filled with L.B. Foster Company’s historical and projected data for accurate analysis.
- Completely Customizable Template: Easily adjust key inputs such as revenue growth, WACC, and EBITDA %.
- Instant Calculations: Watch L.B. Foster Company’s intrinsic value update in real-time based on your modifications.
- Expert Valuation Tool: Tailored for investors, analysts, and consultants aiming for precise DCF results.
- Intuitive Design: User-friendly layout and straightforward instructions suitable for all skill levels.
Key Features
- Comprehensive FSTR Data: Pre-loaded with L.B. Foster Company's historical performance metrics and future projections.
- Customizable Variables: Modify revenue growth rates, profit margins, WACC, tax rates, and capital investment figures.
- Interactive Valuation Model: Instantaneous updates to Net Present Value (NPV) and intrinsic valuation based on user inputs.
- Scenario Analysis: Develop various forecasting scenarios to evaluate different valuation results.
- Intuitive Interface: Designed with simplicity in mind, catering to both professionals and novices.
How It Works
- Step 1: Download the Excel file for L.B. Foster Company (FSTR).
- Step 2: Review the pre-filled financial data and forecasts for L.B. Foster Company (FSTR).
- Step 3: Adjust key inputs such as revenue growth, WACC, and tax rates (highlighted cells) for L.B. Foster Company (FSTR).
- Step 4: Observe the DCF model update in real-time as you modify your assumptions for L.B. Foster Company (FSTR).
- Step 5: Evaluate the outputs and leverage the results for your investment decisions regarding L.B. Foster Company (FSTR).
Why Choose L.B. Foster Company (FSTR)?
- Proven Expertise: Benefit from decades of industry experience and knowledge.
- Innovative Solutions: Access cutting-edge products designed to meet modern demands.
- Comprehensive Support: Enjoy dedicated customer service and technical assistance.
- Commitment to Quality: Rely on high standards and rigorous testing for all our offerings.
- Industry Leadership: Join a community of satisfied clients who trust our solutions.
Who Should Use This Product?
- Individual Investors: Make informed decisions about buying or selling L.B. Foster Company (FSTR) stock.
- Financial Analysts: Streamline valuation processes with ready-to-use financial models for L.B. Foster Company (FSTR).
- Consultants: Deliver professional valuation insights on L.B. Foster Company (FSTR) to clients quickly and accurately.
- Business Owners: Understand how companies like L.B. Foster Company (FSTR) are valued to guide your own strategy.
- Finance Students: Learn valuation techniques using real-world data and scenarios related to L.B. Foster Company (FSTR).
What the Template Contains
- Pre-Filled Data: Includes L.B. Foster Company's historical financials and forecasts.
- Discounted Cash Flow Model: Editable DCF valuation model with automatic calculations.
- Weighted Average Cost of Capital (WACC): A dedicated sheet for calculating WACC based on custom inputs.
- Key Financial Ratios: Analyze L.B. Foster Company's profitability, efficiency, and leverage.
- Customizable Inputs: Edit revenue growth, margins, and tax rates with ease.
- Clear Dashboard: Charts and tables summarizing key valuation results.
Disclaimer
All information, articles, and product details provided on this website are for general informational and educational purposes only. We do not claim any ownership over, nor do we intend to infringe upon, any trademarks, copyrights, logos, brand names, or other intellectual property mentioned or depicted on this site. Such intellectual property remains the property of its respective owners, and any references here are made solely for identification or informational purposes, without implying any affiliation, endorsement, or partnership.
We make no representations or warranties, express or implied, regarding the accuracy, completeness, or suitability of any content or products presented. Nothing on this website should be construed as legal, tax, investment, financial, medical, or other professional advice. In addition, no part of this site—including articles or product references—constitutes a solicitation, recommendation, endorsement, advertisement, or offer to buy or sell any securities, franchises, or other financial instruments, particularly in jurisdictions where such activity would be unlawful.
All content is of a general nature and may not address the specific circumstances of any individual or entity. It is not a substitute for professional advice or services. Any actions you take based on the information provided here are strictly at your own risk. You accept full responsibility for any decisions or outcomes arising from your use of this website and agree to release us from any liability in connection with your use of, or reliance upon, the content or products found herein.