
|
Fuel Tech, Inc. (FTEK) DCF -Bewertung |
Fully Editable: Tailor To Your Needs In Excel Or Sheets
Professional Design: Trusted, Industry-Standard Templates
Investor-Approved Valuation Models
MAC/PC Compatible, Fully Unlocked
No Expertise Is Needed; Easy To Follow
Fuel Tech, Inc. (FTEK) Bundle
Verbessern Sie Ihre Investitionsauswahl mit dem DCF -Taschenrechner von Fuel Tech, Inc. (FTEK)! Verwenden Sie echte Finanzdaten für Kraftstofftechnologie, passen Sie Wachstumsprojektionen und -kosten an und beobachten Sie sofort, wie sich diese Modifikationen auf den inneren Wert von Fuel Tech, Inc. (FTEK) auswirken.
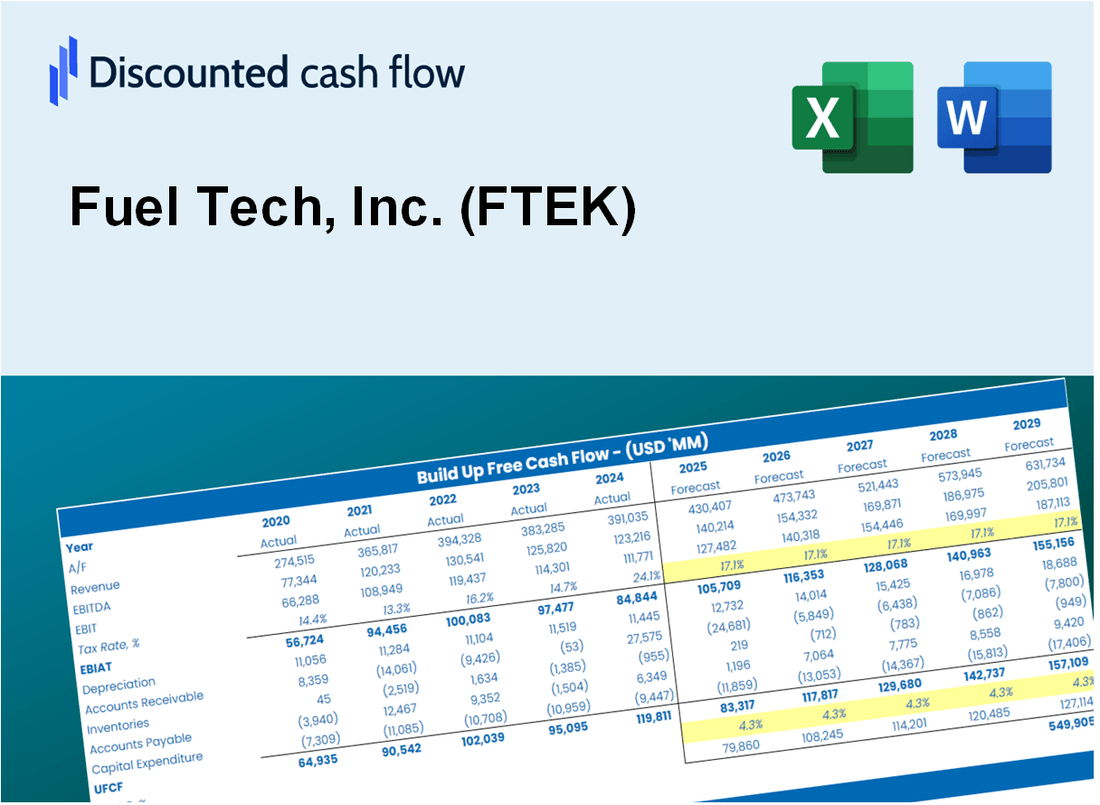
Discounted Cash Flow (DCF) - (USD MM)
| Year | AY1 2020 |
AY2 2021 |
AY3 2022 |
AY4 2023 |
AY5 2024 |
FY1 2025 |
FY2 2026 |
FY3 2027 |
FY4 2028 |
FY5 2029 |
|---|---|---|---|---|---|---|---|---|---|---|
| Revenue | 22.6 | 24.3 | 26.9 | 27.1 | 25.1 | 25.9 | 26.7 | 27.5 | 28.3 | 29.1 |
| Revenue Growth, % | 0 | 7.59 | 11.05 | 0.51965 | -7.19 | 2.99 | 2.99 | 2.99 | 2.99 | 2.99 |
| EBITDA | -3.4 | -.7 | -.9 | -1.1 | -1.4 | -1.6 | -1.7 | -1.7 | -1.8 | -1.8 |
| EBITDA, % | -14.94 | -3.08 | -3.46 | -4.08 | -5.59 | -6.23 | -6.23 | -6.23 | -6.23 | -6.23 |
| Depreciation | .8 | .7 | .4 | .3 | .5 | .6 | .6 | .6 | .7 | .7 |
| Depreciation, % | 3.76 | 3.05 | 1.63 | 1.26 | 1.83 | 2.31 | 2.31 | 2.31 | 2.31 | 2.31 |
| EBIT | -4.2 | -1.5 | -1.4 | -1.4 | -1.9 | -2.2 | -2.3 | -2.3 | -2.4 | -2.5 |
| EBIT, % | -18.7 | -6.14 | -5.09 | -5.35 | -7.42 | -8.54 | -8.54 | -8.54 | -8.54 | -8.54 |
| Total Cash | 10.6 | 35.9 | 26.3 | 29.7 | 18.7 | 21.7 | 22.4 | 23.0 | 23.7 | 24.4 |
| Total Cash, percent | .0 | .0 | .0 | .0 | .0 | .0 | .0 | .0 | .0 | .0 |
| Account Receivables | 6.5 | 3.3 | 7.7 | 6.7 | 9.4 | 6.9 | 7.1 | 7.3 | 7.5 | 7.8 |
| Account Receivables, % | 29.04 | 13.43 | 28.69 | 24.85 | 37.27 | 26.66 | 26.66 | 26.66 | 26.66 | 26.66 |
| Inventories | .1 | .3 | .4 | .4 | .4 | .3 | .3 | .4 | .4 | .4 |
| Inventories, % | 0.43016 | 1.43 | 1.46 | 1.62 | 1.58 | 1.3 | 1.3 | 1.3 | 1.3 | 1.3 |
| Accounts Payable | 2.4 | 1.6 | 2.7 | 2.4 | 2.9 | 2.5 | 2.5 | 2.6 | 2.7 | 2.8 |
| Accounts Payable, % | 10.43 | 6.43 | 10.06 | 8.94 | 11.6 | 9.49 | 9.49 | 9.49 | 9.49 | 9.49 |
| Capital Expenditure | -.2 | -.1 | -.2 | -.4 | -.4 | -.3 | -.3 | -.3 | -.3 | -.3 |
| Capital Expenditure, % | -1.1 | -0.34623 | -0.76463 | -1.54 | -1.5 | -1.05 | -1.05 | -1.05 | -1.05 | -1.05 |
| Tax Rate, % | -4.13 | -4.13 | -4.13 | -4.13 | -4.13 | -4.13 | -4.13 | -4.13 | -4.13 | -4.13 |
| EBITAT | -4.3 | -1.2 | -1.4 | -1.5 | -1.9 | -2.1 | -2.2 | -2.2 | -2.3 | -2.4 |
| Depreciation | ||||||||||
| Changes in Account Receivables | ||||||||||
| Changes in Inventories | ||||||||||
| Changes in Accounts Payable | ||||||||||
| Capital Expenditure | ||||||||||
| UFCF | -8.0 | 1.7 | -4.6 | -.9 | -4.0 | .3 | -2.0 | -2.1 | -2.1 | -2.2 |
| WACC, % | 26.62 | 26.61 | 26.62 | 26.62 | 26.62 | 26.61 | 26.61 | 26.61 | 26.61 | 26.61 |
| PV UFCF | ||||||||||
| SUM PV UFCF | -3.5 | |||||||||
| Long Term Growth Rate, % | 4.00 | |||||||||
| Free cash flow (T + 1) | -2 | |||||||||
| Terminal Value | -10 | |||||||||
| Present Terminal Value | -3 | |||||||||
| Enterprise Value | -7 | |||||||||
| Net Debt | -8 | |||||||||
| Equity Value | 1 | |||||||||
| Diluted Shares Outstanding, MM | 31 | |||||||||
| Equity Value Per Share | 0.04 |
What You Will Get
- Real Fuel Tech Data: Preloaded financials – from revenue to EBIT – based on actual and projected figures for Fuel Tech, Inc. (FTEK).
- Full Customization: Adjust all critical parameters (yellow cells) such as WACC, growth %, and tax rates specific to Fuel Tech, Inc. (FTEK).
- Instant Valuation Updates: Automatic recalculations to analyze the impact of changes on Fuel Tech, Inc. (FTEK)’s fair value.
- Versatile Excel Template: Tailored for quick edits, scenario testing, and detailed projections for Fuel Tech, Inc. (FTEK).
- Time-Saving and Accurate: Skip building models from scratch while maintaining precision and flexibility for Fuel Tech, Inc. (FTEK).
Key Features
- 🔍 Real-Life FTEK Financials: Pre-filled historical and projected data for Fuel Tech, Inc. (FTEK).
- ✏️ Fully Customizable Inputs: Adjust all critical parameters (yellow cells) like WACC, growth %, and tax rates.
- 📊 Professional DCF Valuation: Built-in formulas calculate Fuel Tech’s intrinsic value using the Discounted Cash Flow method.
- ⚡ Instant Results: Visualize Fuel Tech’s valuation instantly after making changes.
- Scenario Analysis: Test and compare outcomes for various financial assumptions side-by-side.
How It Works
- Download: Access the ready-to-use Excel file containing Fuel Tech, Inc.'s (FTEK) financial data.
- Customize: Modify forecasts, including revenue growth, EBITDA %, and WACC.
- Update Automatically: The intrinsic value and NPV calculations refresh in real-time.
- Test Scenarios: Generate multiple projections and compare results instantly.
- Make Decisions: Utilize the valuation results to inform your investment strategy.
Why Choose This Calculator for Fuel Tech, Inc. (FTEK)?
- All-in-One Solution: Combines DCF, WACC, and financial ratio analyses tailored for Fuel Tech, Inc. (FTEK).
- Flexible Inputs: Modify yellow-highlighted cells to explore different financial scenarios for Fuel Tech, Inc. (FTEK).
- In-Depth Analysis: Automatically computes Fuel Tech, Inc. (FTEK)'s intrinsic value and Net Present Value.
- Integrated Data: Historical and projected data provide reliable baselines for analysis.
- High-Quality Standards: Perfect for financial analysts, investors, and consultants focused on Fuel Tech, Inc. (FTEK).
Who Should Use Fuel Tech, Inc. (FTEK)?
- Investors: Gain insights into cutting-edge technologies for informed investment choices.
- Environmental Consultants: Utilize our solutions to enhance sustainability in projects.
- Government Agencies: Implement effective pollution control measures with our advanced systems.
- Industry Professionals: Stay updated on innovative fuel technologies to improve operational efficiency.
- Academics and Researchers: Explore real-world applications of environmental technologies in your studies.
What the Template Contains
- Historical Data: Includes Fuel Tech, Inc.'s (FTEK) past financials and baseline forecasts.
- DCF and Levered DCF Models: Detailed templates to calculate Fuel Tech, Inc.'s (FTEK) intrinsic value.
- WACC Sheet: Pre-built calculations for Weighted Average Cost of Capital.
- Editable Inputs: Modify key drivers like growth rates, EBITDA %, and CAPEX assumptions.
- Quarterly and Annual Statements: A complete breakdown of Fuel Tech, Inc.'s (FTEK) financials.
- Interactive Dashboard: Visualize valuation results and projections dynamically.
Disclaimer
All information, articles, and product details provided on this website are for general informational and educational purposes only. We do not claim any ownership over, nor do we intend to infringe upon, any trademarks, copyrights, logos, brand names, or other intellectual property mentioned or depicted on this site. Such intellectual property remains the property of its respective owners, and any references here are made solely for identification or informational purposes, without implying any affiliation, endorsement, or partnership.
We make no representations or warranties, express or implied, regarding the accuracy, completeness, or suitability of any content or products presented. Nothing on this website should be construed as legal, tax, investment, financial, medical, or other professional advice. In addition, no part of this site—including articles or product references—constitutes a solicitation, recommendation, endorsement, advertisement, or offer to buy or sell any securities, franchises, or other financial instruments, particularly in jurisdictions where such activity would be unlawful.
All content is of a general nature and may not address the specific circumstances of any individual or entity. It is not a substitute for professional advice or services. Any actions you take based on the information provided here are strictly at your own risk. You accept full responsibility for any decisions or outcomes arising from your use of this website and agree to release us from any liability in connection with your use of, or reliance upon, the content or products found herein.