
|
Future Fintech Group Inc. (FTFT) DCF -Bewertung |
Fully Editable: Tailor To Your Needs In Excel Or Sheets
Professional Design: Trusted, Industry-Standard Templates
Investor-Approved Valuation Models
MAC/PC Compatible, Fully Unlocked
No Expertise Is Needed; Easy To Follow
Future FinTech Group Inc. (FTFT) Bundle
Bewerten Sie die finanziellen Aussichten der zukünftigen Fintech Group Inc. wie ein Experte! Dieser (FTFT) DCF-Taschenrechner bietet vorgefüllte Finanzdaten und bietet eine vollständige Flexibilität, um das Umsatzwachstum, WACC, Margen und andere wesentliche Annahmen zu ändern, um sich an Ihren Projektionen anzupassen.
What You Will Get
- Real FTFT Financial Data: Pre-filled with Future FinTech Group Inc.’s historical and projected data for precise analysis.
- Fully Editable Template: Modify key inputs like revenue growth, WACC, and EBITDA % with ease.
- Automatic Calculations: See Future FinTech Group Inc.’s intrinsic value update instantly based on your changes.
- Professional Valuation Tool: Designed for investors, analysts, and consultants seeking accurate DCF results.
- User-Friendly Design: Simple structure and clear instructions for all experience levels.
Key Features
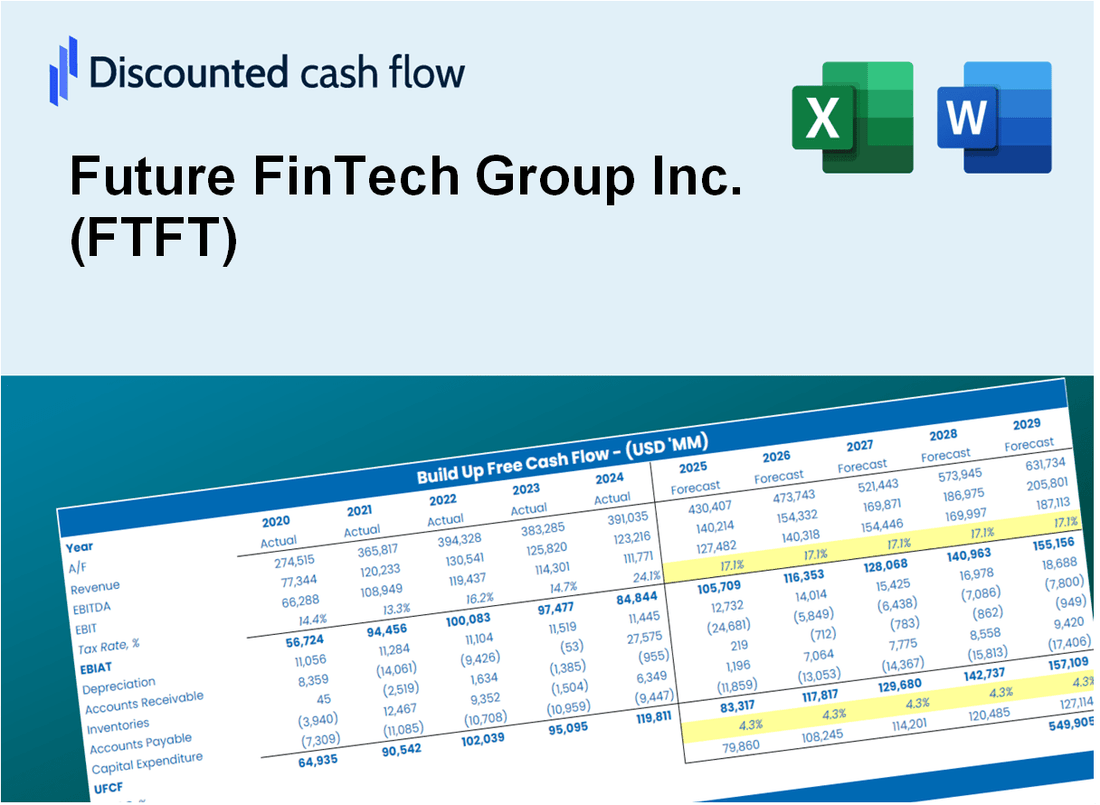
- Comprehensive Data: Future FinTech Group Inc.'s (FTFT) detailed historical financials and projected forecasts.
- Customizable Parameters: Adjust WACC, tax rates, revenue growth, and EBITDA margins to suit your analysis.
- Real-Time Insights: Instantly view the recalculated intrinsic value of Future FinTech Group Inc. (FTFT).
- Visual Analytics: Interactive dashboard charts illustrate valuation outcomes and essential metrics.
- Designed for Precision: A robust tool tailored for analysts, investors, and finance professionals.
How It Works
- Step 1: Download the Excel file.
- Step 2: Review Future FinTech Group Inc.'s (FTFT) pre-filled financial data and projections.
- Step 3: Adjust key inputs such as revenue growth, WACC, and tax rates (highlighted cells).
- Step 4: Observe the DCF model update in real-time as you modify your assumptions.
- Step 5: Evaluate the outputs and leverage the findings for your investment strategies.
Why Choose Future FinTech Group Inc. (FTFT)?
- Time Efficiency: Skip the lengthy setup process – our solutions are ready for immediate use.
- Enhanced Accuracy: Our reliable financial insights and calculations minimize valuation errors.
- Completely Customizable: Adapt our tools to align with your unique forecasts and assumptions.
- User-Friendly: Intuitive visuals and outputs simplify the analysis of results.
- Preferred by Professionals: Crafted for industry experts who prioritize accuracy and functionality.
Who Should Use Future FinTech Group Inc. (FTFT)?
- Investors: Evaluate Future FinTech's market potential before making investment decisions.
- CFOs and Financial Analysts: Enhance financial assessments and validate forecasts for FTFT.
- Startup Founders: Discover how fintech companies like Future FinTech are valued in the market.
- Consultants: Provide comprehensive valuation analyses for clients interested in FTFT.
- Students and Educators: Utilize current data to learn and teach financial valuation methodologies.
What the Template Contains
- Pre-Filled DCF Model: Future FinTech Group Inc.'s (FTFT) financial data preloaded for immediate use.
- WACC Calculator: Detailed calculations for Weighted Average Cost of Capital tailored for (FTFT).
- Financial Ratios: Assess Future FinTech Group Inc.'s (FTFT) profitability, leverage, and efficiency metrics.
- Editable Inputs: Modify assumptions such as growth, margins, and CAPEX to align with your scenarios for (FTFT).
- Financial Statements: Annual and quarterly reports for Future FinTech Group Inc. (FTFT) to support comprehensive analysis.
- Interactive Dashboard: Effortlessly visualize key valuation metrics and results for (FTFT).
Disclaimer
All information, articles, and product details provided on this website are for general informational and educational purposes only. We do not claim any ownership over, nor do we intend to infringe upon, any trademarks, copyrights, logos, brand names, or other intellectual property mentioned or depicted on this site. Such intellectual property remains the property of its respective owners, and any references here are made solely for identification or informational purposes, without implying any affiliation, endorsement, or partnership.
We make no representations or warranties, express or implied, regarding the accuracy, completeness, or suitability of any content or products presented. Nothing on this website should be construed as legal, tax, investment, financial, medical, or other professional advice. In addition, no part of this site—including articles or product references—constitutes a solicitation, recommendation, endorsement, advertisement, or offer to buy or sell any securities, franchises, or other financial instruments, particularly in jurisdictions where such activity would be unlawful.
All content is of a general nature and may not address the specific circumstances of any individual or entity. It is not a substitute for professional advice or services. Any actions you take based on the information provided here are strictly at your own risk. You accept full responsibility for any decisions or outcomes arising from your use of this website and agree to release us from any liability in connection with your use of, or reliance upon, the content or products found herein.