
|
Fortis Inc. (FTS) DCF -Bewertung |
Fully Editable: Tailor To Your Needs In Excel Or Sheets
Professional Design: Trusted, Industry-Standard Templates
Investor-Approved Valuation Models
MAC/PC Compatible, Fully Unlocked
No Expertise Is Needed; Easy To Follow
Fortis Inc. (FTS) Bundle
Stürzen Sie Ihre Analyse und verbessern Sie die Präzision mit unserem (FTS) DCF -Taschenrechner! Mit tatsächlichen Daten von Fortis Inc. und anpassbaren Annahmen können Sie dieses Tool wie ein erfahrener Investor prognostizieren, analysieren und bewerten (FTS) beurteilen.
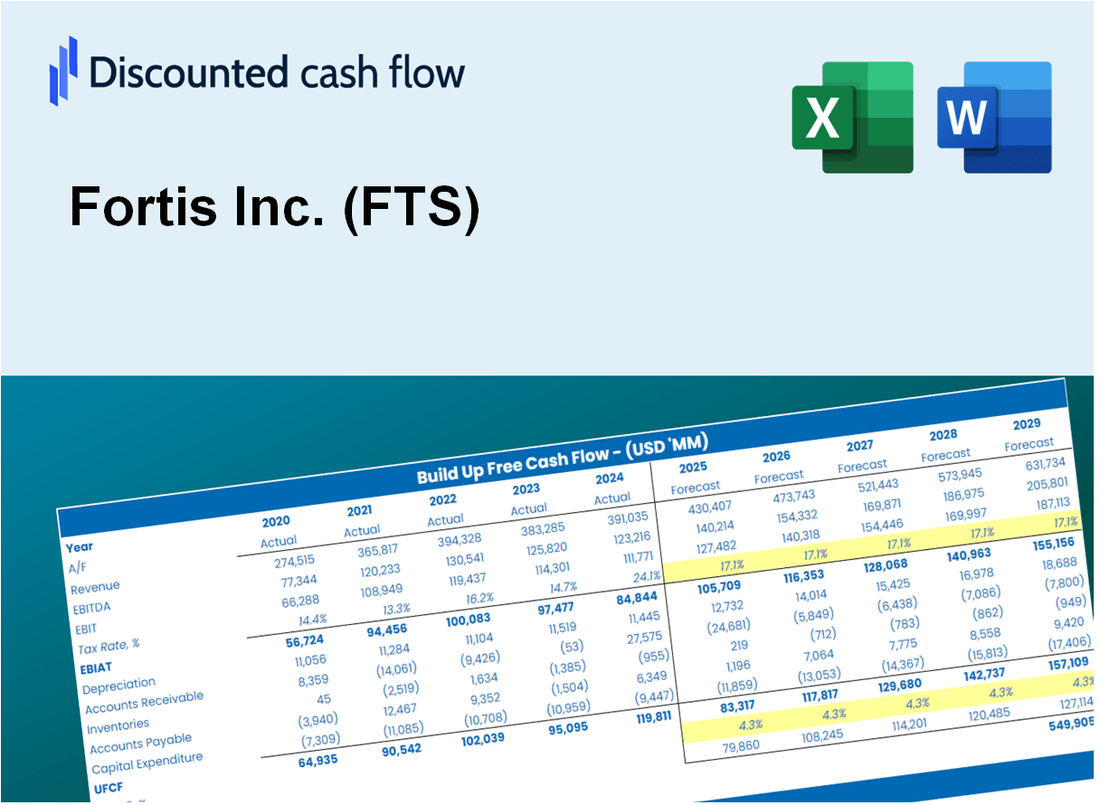
Discounted Cash Flow (DCF) - (USD MM)
| Year | AY1 2020 |
AY2 2021 |
AY3 2022 |
AY4 2023 |
AY5 2024 |
FY1 2025 |
FY2 2026 |
FY3 2027 |
FY4 2028 |
FY5 2029 |
|---|---|---|---|---|---|---|---|---|---|---|
| Revenue | 6,402.6 | 6,770.2 | 7,913.1 | 8,252.8 | 8,246.3 | 8,799.6 | 9,390.0 | 10,020.0 | 10,692.3 | 11,409.7 |
| Revenue Growth, % | 0 | 5.74 | 16.88 | 4.29 | -0.07814535 | 6.71 | 6.71 | 6.71 | 6.71 | 6.71 |
| EBITDA | 2,930.8 | 2,971.6 | 3,224.6 | 3,688.9 | 3,946.2 | 3,924.1 | 4,187.4 | 4,468.3 | 4,768.1 | 5,088.0 |
| EBITDA, % | 45.78 | 43.89 | 40.75 | 44.7 | 47.85 | 44.59 | 44.59 | 44.59 | 44.59 | 44.59 |
| Depreciation | 1,023.3 | 1,078.4 | 1,195.2 | 1,270.5 | 1,380.8 | 1,393.1 | 1,486.5 | 1,586.3 | 1,692.7 | 1,806.3 |
| Depreciation, % | 15.98 | 15.93 | 15.1 | 15.39 | 16.74 | 15.83 | 15.83 | 15.83 | 15.83 | 15.83 |
| EBIT | 1,907.5 | 1,893.2 | 2,029.3 | 2,418.4 | 2,565.3 | 2,531.0 | 2,700.8 | 2,882.1 | 3,075.4 | 3,281.8 |
| EBIT, % | 29.79 | 27.96 | 25.65 | 29.3 | 31.11 | 28.76 | 28.76 | 28.76 | 28.76 | 28.76 |
| Total Cash | 178.4 | 93.9 | 149.8 | 447.9 | 157.6 | 235.9 | 251.7 | 268.6 | 286.6 | 305.9 |
| Total Cash, percent | .0 | .0 | .0 | .0 | .0 | .0 | .0 | .0 | .0 | .0 |
| Account Receivables | 841.3 | 909.3 | 1,260.5 | 1,110.0 | 1,196.0 | 1,239.9 | 1,323.1 | 1,411.9 | 1,506.6 | 1,607.7 |
| Account Receivables, % | 13.14 | 13.43 | 15.93 | 13.45 | 14.5 | 14.09 | 14.09 | 14.09 | 14.09 | 14.09 |
| Inventories | 302.4 | 342.5 | 473.7 | 405.6 | 490.9 | 468.8 | 500.2 | 533.8 | 569.6 | 607.8 |
| Inventories, % | 4.72 | 5.06 | 5.99 | 4.91 | 5.95 | 5.33 | 5.33 | 5.33 | 5.33 | 5.33 |
| Accounts Payable | 506.6 | 554.6 | 634.9 | 709.4 | 803.3 | 747.4 | 797.5 | 851.0 | 908.1 | 969.0 |
| Accounts Payable, % | 7.91 | 8.19 | 8.02 | 8.6 | 9.74 | 8.49 | 8.49 | 8.49 | 8.49 | 8.49 |
| Capital Expenditure | -2,894.2 | -2,426.3 | -2,769.6 | -2,987.4 | -3,739.1 | -3,477.3 | -3,710.6 | -3,959.6 | -4,225.2 | -4,508.7 |
| Capital Expenditure, % | -45.2 | -35.84 | -35 | -36.2 | -45.34 | -39.52 | -39.52 | -39.52 | -39.52 | -39.52 |
| Tax Rate, % | 22.72 | 22.72 | 22.72 | 22.72 | 22.72 | 22.72 | 22.72 | 22.72 | 22.72 | 22.72 |
| EBITAT | 1,500.1 | 1,494.7 | 1,569.0 | 1,837.8 | 1,982.4 | 1,965.0 | 2,096.8 | 2,237.5 | 2,387.6 | 2,547.8 |
| Depreciation | ||||||||||
| Changes in Account Receivables | ||||||||||
| Changes in Inventories | ||||||||||
| Changes in Accounts Payable | ||||||||||
| Capital Expenditure | ||||||||||
| UFCF | -1,007.9 | 86.6 | -407.3 | 413.9 | -453.2 | -197.0 | -191.8 | -204.6 | -218.4 | -233.0 |
| WACC, % | 4.34 | 4.35 | 4.32 | 4.29 | 4.32 | 4.32 | 4.32 | 4.32 | 4.32 | 4.32 |
| PV UFCF | ||||||||||
| SUM PV UFCF | -918.2 | |||||||||
| Long Term Growth Rate, % | 2.00 | |||||||||
| Free cash flow (T + 1) | -238 | |||||||||
| Terminal Value | -10,227 | |||||||||
| Present Terminal Value | -8,276 | |||||||||
| Enterprise Value | -9,194 | |||||||||
| Net Debt | 23,992 | |||||||||
| Equity Value | -33,187 | |||||||||
| Diluted Shares Outstanding, MM | 495 | |||||||||
| Equity Value Per Share | -67.02 |
What You Will Get
- Real FTS Financials: Access to historical and projected data for precise valuation.
- Customizable Inputs: Adjust WACC, tax rates, revenue growth, and capital expenditures as needed.
- Dynamic Calculations: Intrinsic value and NPV are computed in real-time.
- Scenario Analysis: Evaluate various scenarios to assess Fortis Inc.'s future performance.
- User-Friendly Design: Tailored for professionals while remaining approachable for newcomers.
Key Features
- Comprehensive Fortis Financials: Gain access to precise historical data and future forecasts specific to Fortis Inc. (FTS).
- Adjustable Forecast Parameters: Modify highlighted cells for key metrics such as WACC, growth rates, and profit margins.
- Real-Time Calculations: Enjoy automatic updates for DCF, Net Present Value (NPV), and cash flow assessments.
- Interactive Dashboard: Utilize user-friendly charts and summaries to easily interpret your valuation findings.
- Designed for All Skill Levels: An intuitive framework tailored for investors, CFOs, and consultants alike.
How It Works
- Step 1: Download the prebuilt Excel template featuring Fortis Inc. (FTS) data.
- Step 2: Review the pre-filled sheets to familiarize yourself with the essential metrics.
- Step 3: Modify forecasts and assumptions in the editable yellow cells (WACC, growth, margins).
- Step 4: Instantly see the recalculated results, including Fortis Inc.'s (FTS) intrinsic value.
- Step 5: Use the outputs to make informed investment decisions or create detailed reports.
Why Choose This Calculator for Fortis Inc. (FTS)?
- User-Friendly Interface: Perfect for both novices and seasoned professionals.
- Customizable Inputs: Adjust parameters to suit your financial analysis needs.
- Real-Time Valuation: Monitor immediate changes to Fortis Inc.’s valuation as you tweak inputs.
- Preloaded Data: Comes with Fortis Inc.’s actual financial metrics for swift evaluations.
- Endorsed by Experts: Utilized by investors and financial analysts for making well-informed choices.
Who Should Use This Product?
- Investors: Accurately estimate Fortis Inc.’s (FTS) fair value before making investment decisions.
- CFOs: Utilize a professional-grade DCF model for financial reporting and analysis specific to Fortis Inc. (FTS).
- Consultants: Quickly adapt the template for valuation reports tailored to clients interested in Fortis Inc. (FTS).
- Entrepreneurs: Gain insights into financial modeling practices employed by leading utility companies like Fortis Inc. (FTS).
- Educators: Use it as a teaching tool to illustrate valuation methodologies relevant to Fortis Inc. (FTS).
What the Fortis Inc. (FTS) Template Contains
- Preloaded FTS Data: Historical and projected financial information, including revenue, EBIT, and capital expenditures.
- DCF and WACC Models: Professional-grade spreadsheets for determining intrinsic value and Weighted Average Cost of Capital.
- Editable Inputs: Yellow-highlighted cells for modifying revenue growth, tax rates, and discount rates.
- Financial Statements: Detailed annual and quarterly financials for in-depth analysis.
- Key Ratios: Profitability, leverage, and efficiency ratios to assess performance.
- Dashboard and Charts: Visual summaries of valuation results and underlying assumptions.
Disclaimer
All information, articles, and product details provided on this website are for general informational and educational purposes only. We do not claim any ownership over, nor do we intend to infringe upon, any trademarks, copyrights, logos, brand names, or other intellectual property mentioned or depicted on this site. Such intellectual property remains the property of its respective owners, and any references here are made solely for identification or informational purposes, without implying any affiliation, endorsement, or partnership.
We make no representations or warranties, express or implied, regarding the accuracy, completeness, or suitability of any content or products presented. Nothing on this website should be construed as legal, tax, investment, financial, medical, or other professional advice. In addition, no part of this site—including articles or product references—constitutes a solicitation, recommendation, endorsement, advertisement, or offer to buy or sell any securities, franchises, or other financial instruments, particularly in jurisdictions where such activity would be unlawful.
All content is of a general nature and may not address the specific circumstances of any individual or entity. It is not a substitute for professional advice or services. Any actions you take based on the information provided here are strictly at your own risk. You accept full responsibility for any decisions or outcomes arising from your use of this website and agree to release us from any liability in connection with your use of, or reliance upon, the content or products found herein.