
|
Galectin Therapeutics Inc. (GALT) DCF -Bewertung |
Fully Editable: Tailor To Your Needs In Excel Or Sheets
Professional Design: Trusted, Industry-Standard Templates
Investor-Approved Valuation Models
MAC/PC Compatible, Fully Unlocked
No Expertise Is Needed; Easy To Follow
Galectin Therapeutics Inc. (GALT) Bundle
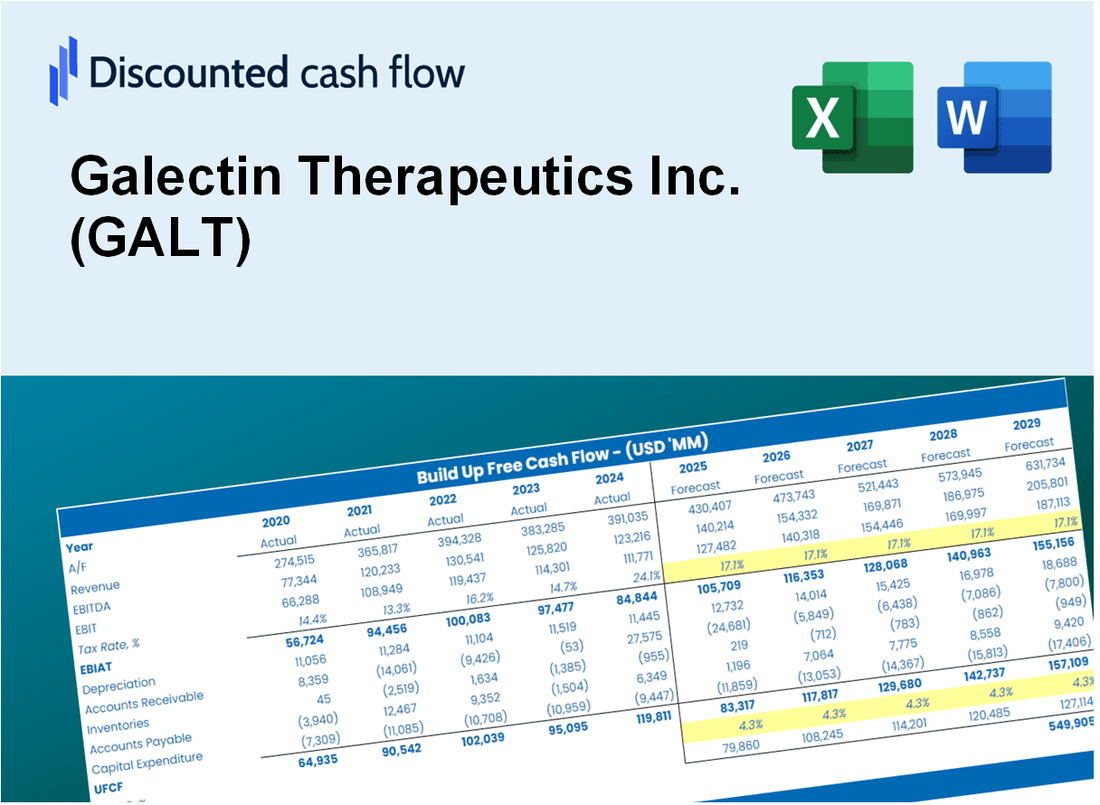
Gewinnen Sie mit unserem ausgefeilten DCF -Taschenrechner Einblicke in Ihre Galectin Therapeutics Inc. (GALT) -Schanganalyse! Diese Excel -Vorlage wird mit realen GALT -Daten vorinstalliert, sodass Sie Prognosen und Annahmen für eine genaue Berechnung des intrinsischen Wertes von Galectin Therapeutics Inc. anpassen können.
Discounted Cash Flow (DCF) - (USD MM)
| Year | AY1 2020 |
AY2 2021 |
AY3 2022 |
AY4 2023 |
AY5 2024 |
FY1 2025 |
FY2 2026 |
FY3 2027 |
FY4 2028 |
FY5 2029 |
|---|---|---|---|---|---|---|---|---|---|---|
| Revenue | .0 | .0 | .0 | .0 | .0 | .0 | .0 | .0 | .0 | .0 |
| Revenue Growth, % | 0 | 0 | 0 | 0 | 0 | 0 | 0 | 0 | 0 | 0 |
| EBITDA | -23.3 | -30.0 | -37.7 | -38.2 | -41.5 | .0 | .0 | .0 | .0 | .0 |
| EBITDA, % | 100 | 100 | 100 | 100 | 100 | 100 | 100 | 100 | 100 | 100 |
| Depreciation | .0 | .0 | .0 | .0 | .0 | .0 | .0 | .0 | .0 | .0 |
| Depreciation, % | 100 | 100 | 100 | 100 | 100 | 100 | 100 | 100 | 100 | 100 |
| EBIT | -23.4 | -30.0 | -37.7 | -38.3 | -41.5 | .0 | .0 | .0 | .0 | .0 |
| EBIT, % | 100 | 100 | 100 | 100 | 100 | 100 | 100 | 100 | 100 | 100 |
| Total Cash | 27.1 | 39.6 | 18.6 | 25.7 | 15.1 | .0 | .0 | .0 | .0 | .0 |
| Total Cash, percent | .0 | .0 | .0 | .0 | .0 | .0 | .0 | .0 | .0 | .0 |
| Account Receivables | .0 | .0 | .0 | .0 | .0 | .0 | .0 | .0 | .0 | .0 |
| Account Receivables, % | 100 | 100 | 100 | 100 | 100 | 100 | 100 | 100 | 100 | 100 |
| Inventories | .0 | .0 | .0 | .0 | .0 | .0 | .0 | .0 | .0 | .0 |
| Inventories, % | 100 | 100 | 100 | 100 | 100 | 100 | 100 | 100 | 100 | 100 |
| Accounts Payable | 1.3 | 1.8 | 3.9 | 6.4 | 5.7 | .0 | .0 | .0 | .0 | .0 |
| Accounts Payable, % | 100 | 100 | 100 | 100 | 100 | 100 | 100 | 100 | 100 | 100 |
| Capital Expenditure | .0 | .0 | .0 | .0 | .0 | .0 | .0 | .0 | .0 | .0 |
| Capital Expenditure, % | 100 | 100 | 100 | 100 | 100 | 0 | 0 | 0 | 0 | 0 |
| Tax Rate, % | 0 | 0 | 0 | 0 | 0 | 0 | 0 | 0 | 0 | 0 |
| EBITAT | -23.4 | -30.0 | -37.7 | -38.3 | -41.5 | .0 | .0 | .0 | .0 | .0 |
| Depreciation | ||||||||||
| Changes in Account Receivables | ||||||||||
| Changes in Inventories | ||||||||||
| Changes in Accounts Payable | ||||||||||
| Capital Expenditure | ||||||||||
| UFCF | -22.1 | -29.5 | -35.6 | -35.7 | -42.2 | -5.7 | .0 | .0 | .0 | .0 |
| WACC, % | 7.53 | 7.53 | 7.53 | 7.53 | 7.53 | 7.53 | 7.53 | 7.53 | 7.53 | 7.53 |
| PV UFCF | ||||||||||
| SUM PV UFCF | -5.3 | |||||||||
| Long Term Growth Rate, % | 2.00 | |||||||||
| Free cash flow (T + 1) | 0 | |||||||||
| Terminal Value | 0 | |||||||||
| Present Terminal Value | 0 | |||||||||
| Enterprise Value | -5 | |||||||||
| Net Debt | 91 | |||||||||
| Equity Value | -96 | |||||||||
| Diluted Shares Outstanding, MM | 62 | |||||||||
| Equity Value Per Share | -1.55 |
What You Will Get
- Real GALT Financial Data: Pre-filled with Galectin Therapeutics’ historical and projected data for precise analysis.
- Fully Editable Template: Modify key inputs like revenue growth, WACC, and EBITDA % with ease.
- Automatic Calculations: See Galectin Therapeutics’ intrinsic value update instantly based on your changes.
- Professional Valuation Tool: Designed for investors, analysts, and consultants seeking accurate DCF results.
- User-Friendly Design: Simple structure and clear instructions for all experience levels.
Key Features
- 🔍 Real-Life GALT Financials: Pre-filled historical and projected data for Galectin Therapeutics Inc. (GALT).
- ✏️ Fully Customizable Inputs: Adjust all critical parameters (yellow cells) such as WACC, growth %, and tax rates.
- 📊 Professional DCF Valuation: Built-in formulas calculate Galectin’s intrinsic value using the Discounted Cash Flow method.
- ⚡ Instant Results: Visualize Galectin’s valuation instantly after making adjustments.
- Scenario Analysis: Test and compare outcomes for various financial assumptions side-by-side.
How It Works
- Step 1: Download the Excel file.
- Step 2: Review pre-entered Galectin Therapeutics Inc. (GALT) data (historical and projected).
- Step 3: Adjust key assumptions (yellow cells) based on your analysis.
- Step 4: View automatic recalculations for Galectin Therapeutics Inc. (GALT)'s intrinsic value.
- Step 5: Use the outputs for investment decisions or reporting.
Why Choose This Calculator for Galectin Therapeutics Inc. (GALT)?
- Accurate Data: Utilize real Galectin Therapeutics financials for dependable valuation outcomes.
- Customizable: Modify essential parameters such as growth rates, WACC, and tax rates to align with your forecasts.
- Time-Saving: Pre-constructed calculations save you from starting over.
- Professional-Grade Tool: Tailored for investors, analysts, and consultants in the biotech sector.
- User-Friendly: Easy-to-navigate design and clear instructions cater to users of all experience levels.
Who Should Use This Product?
- Healthcare Investors: Develop comprehensive and accurate valuation models for analyzing Galectin Therapeutics Inc. (GALT).
- Pharmaceutical Finance Teams: Evaluate valuation scenarios to inform strategic decisions within the company.
- Consultants and Advisors: Offer clients precise valuation insights regarding Galectin Therapeutics Inc. (GALT).
- Students and Educators: Utilize real-world data to enhance learning and practice in financial modeling.
- Biotech Enthusiasts: Gain insights into how biotech companies like Galectin Therapeutics Inc. (GALT) are valued in the market.
What the Template Contains
- Pre-Filled DCF Model: Galectin Therapeutics Inc.’s (GALT) financial data preloaded for immediate use.
- WACC Calculator: Detailed calculations for Weighted Average Cost of Capital specific to Galectin Therapeutics Inc. (GALT).
- Financial Ratios: Evaluate Galectin Therapeutics Inc.’s (GALT) profitability, leverage, and efficiency.
- Editable Inputs: Change assumptions such as growth, margins, and CAPEX to fit your scenarios for Galectin Therapeutics Inc. (GALT).
- Financial Statements: Annual and quarterly reports for Galectin Therapeutics Inc. (GALT) to support detailed analysis.
- Interactive Dashboard: Easily visualize key valuation metrics and results for Galectin Therapeutics Inc. (GALT).
Disclaimer
All information, articles, and product details provided on this website are for general informational and educational purposes only. We do not claim any ownership over, nor do we intend to infringe upon, any trademarks, copyrights, logos, brand names, or other intellectual property mentioned or depicted on this site. Such intellectual property remains the property of its respective owners, and any references here are made solely for identification or informational purposes, without implying any affiliation, endorsement, or partnership.
We make no representations or warranties, express or implied, regarding the accuracy, completeness, or suitability of any content or products presented. Nothing on this website should be construed as legal, tax, investment, financial, medical, or other professional advice. In addition, no part of this site—including articles or product references—constitutes a solicitation, recommendation, endorsement, advertisement, or offer to buy or sell any securities, franchises, or other financial instruments, particularly in jurisdictions where such activity would be unlawful.
All content is of a general nature and may not address the specific circumstances of any individual or entity. It is not a substitute for professional advice or services. Any actions you take based on the information provided here are strictly at your own risk. You accept full responsibility for any decisions or outcomes arising from your use of this website and agree to release us from any liability in connection with your use of, or reliance upon, the content or products found herein.