
|
Gambling.com Group Limited (GAMB) DCF -Bewertung |
Fully Editable: Tailor To Your Needs In Excel Or Sheets
Professional Design: Trusted, Industry-Standard Templates
Investor-Approved Valuation Models
MAC/PC Compatible, Fully Unlocked
No Expertise Is Needed; Easy To Follow
Gambling.com Group Limited (GAMB) Bundle
Unser (Gamb) DCF-Taschenrechner entwickelt für die Genauigkeit und ermöglicht es Ihnen, die Bewertung von Gambling.com Group Limited mithilfe realer Finanzdaten zu bewerten, wodurch alle wichtigen Parameter für erweiterte Projektionen geändert werden können.
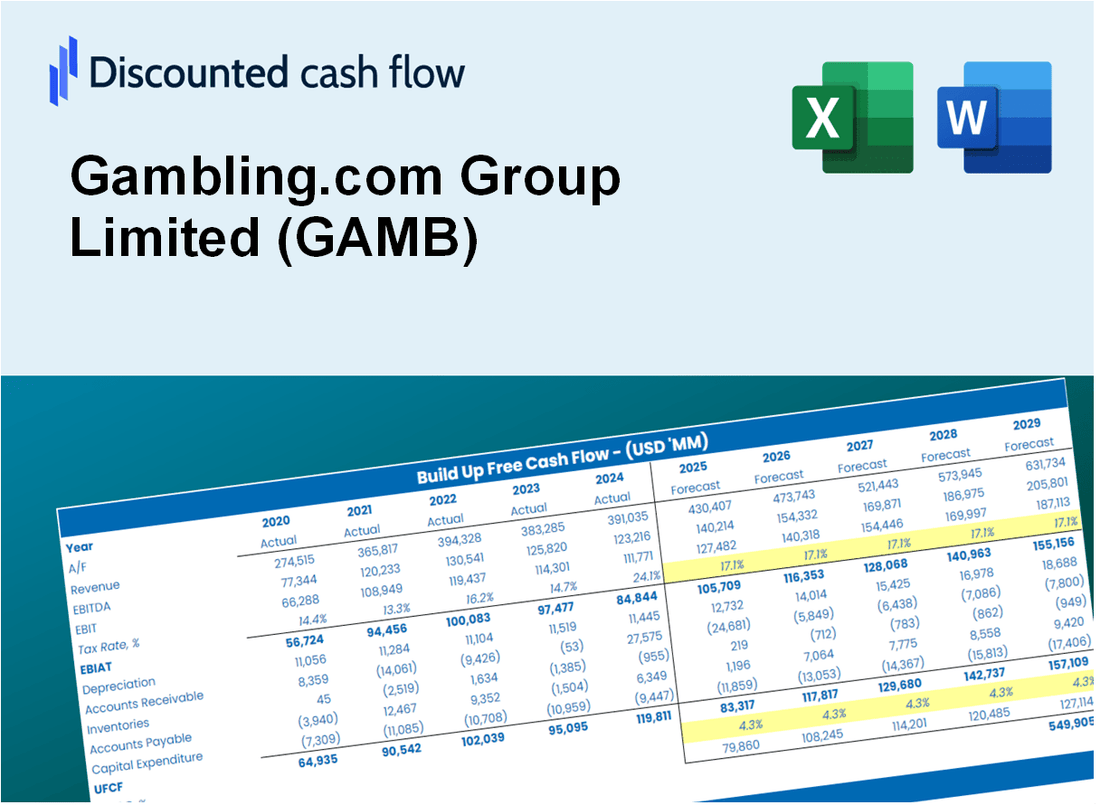
Discounted Cash Flow (DCF) - (USD MM)
| Year | AY1 2020 |
AY2 2021 |
AY3 2022 |
AY4 2023 |
AY5 2024 |
FY1 2025 |
FY2 2026 |
FY3 2027 |
FY4 2028 |
FY5 2029 |
|---|---|---|---|---|---|---|---|---|---|---|
| Revenue | 28.0 | 42.3 | 76.5 | 108.7 | 127.2 | 187.9 | 277.7 | 410.4 | 606.5 | 896.3 |
| Revenue Growth, % | 0 | 51.26 | 80.77 | 42.02 | 17.05 | 47.78 | 47.78 | 47.78 | 47.78 | 47.78 |
| EBITDA | 14.7 | 15.2 | 10.8 | 23.1 | 42.8 | 59.2 | 87.5 | 129.4 | 191.2 | 282.5 |
| EBITDA, % | 52.55 | 35.99 | 14.16 | 21.29 | 33.61 | 31.52 | 31.52 | 31.52 | 31.52 | 31.52 |
| Depreciation | 2.2 | 2.4 | 7.0 | 2.1 | 5.8 | 11.0 | 16.2 | 24.0 | 35.4 | 52.4 |
| Depreciation, % | 7.96 | 5.67 | 9.1 | 1.92 | 4.56 | 5.84 | 5.84 | 5.84 | 5.84 | 5.84 |
| EBIT | 12.5 | 12.8 | 3.9 | 21.0 | 36.9 | 48.3 | 71.3 | 105.4 | 155.7 | 230.1 |
| EBIT, % | 44.59 | 30.32 | 5.06 | 19.37 | 29.05 | 25.68 | 25.68 | 25.68 | 25.68 | 25.68 |
| Total Cash | 8.2 | 51.2 | 29.7 | 25.4 | 13.7 | 76.1 | 112.4 | 166.1 | 245.5 | 362.7 |
| Total Cash, percent | .0 | .0 | .0 | .0 | .0 | .0 | .0 | .0 | .0 | .0 |
| Account Receivables | 5.0 | 4.0 | 10.8 | 20.1 | 19.5 | 28.3 | 41.8 | 61.7 | 91.2 | 134.7 |
| Account Receivables, % | 17.8 | 9.46 | 14.07 | 18.53 | 15.3 | 15.03 | 15.03 | 15.03 | 15.03 | 15.03 |
| Inventories | .1 | .0 | .1 | .0 | .0 | .1 | .2 | .3 | .4 | .6 |
| Inventories, % | 0.23588 | 0 | 0.09803025 | 0 | 0 | 0.0667826 | 0.0667826 | 0.0667826 | 0.0667826 | 0.0667826 |
| Accounts Payable | .5 | 1.0 | 1.2 | 1.9 | 2.4 | 3.6 | 5.3 | 7.8 | 11.6 | 17.1 |
| Accounts Payable, % | 1.86 | 2.47 | 1.61 | 1.71 | 1.88 | 1.91 | 1.91 | 1.91 | 1.91 | 1.91 |
| Capital Expenditure | -.1 | -5.6 | -9.3 | -9.2 | -33.8 | -22.8 | -33.7 | -49.9 | -73.7 | -108.9 |
| Capital Expenditure, % | -0.32166 | -13.17 | -12.14 | -8.51 | -26.6 | -12.15 | -12.15 | -12.15 | -12.15 | -12.15 |
| Tax Rate, % | 10.16 | 10.16 | 10.16 | 10.16 | 10.16 | 10.16 | 10.16 | 10.16 | 10.16 | 10.16 |
| EBITAT | 17.6 | 13.1 | 3.2 | 19.1 | 33.2 | 44.7 | 66.0 | 97.6 | 144.2 | 213.1 |
| Depreciation | ||||||||||
| Changes in Account Receivables | ||||||||||
| Changes in Inventories | ||||||||||
| Changes in Accounts Payable | ||||||||||
| Capital Expenditure | ||||||||||
| UFCF | 15.2 | 11.5 | -5.8 | 3.3 | 6.4 | 25.1 | 36.7 | 54.2 | 80.1 | 118.3 |
| WACC, % | 7.54 | 7.54 | 7.4 | 7.47 | 7.46 | 7.48 | 7.48 | 7.48 | 7.48 | 7.48 |
| PV UFCF | ||||||||||
| SUM PV UFCF | 241.2 | |||||||||
| Long Term Growth Rate, % | 2.00 | |||||||||
| Free cash flow (T + 1) | 121 | |||||||||
| Terminal Value | 2,201 | |||||||||
| Present Terminal Value | 1,534 | |||||||||
| Enterprise Value | 1,776 | |||||||||
| Net Debt | 14 | |||||||||
| Equity Value | 1,761 | |||||||||
| Diluted Shares Outstanding, MM | 36 | |||||||||
| Equity Value Per Share | 48.47 |
What You Will Get
- Editable Forecast Inputs: Easily modify assumptions (growth %, margins, WACC) to generate various scenarios.
- Real-World Data: Gambling.com Group Limited’s financial data pre-filled to kickstart your analysis.
- Automatic DCF Outputs: The template computes Net Present Value (NPV) and intrinsic value automatically.
- Customizable and Professional: A refined Excel model that adjusts to your valuation requirements.
- Built for Analysts and Investors: Perfect for evaluating projections, confirming strategies, and enhancing efficiency.
Key Features
- Customizable Betting Metrics: Adjust key variables such as market growth, revenue projections, and operational costs.
- Instant Betting Odds Calculation: Quickly computes odds, payouts, and other critical financial metrics.
- Industry-Leading Precision: Leverages Gambling.com Group Limited's (GAMB) real-time data for accurate market assessments.
- Effortless Risk Assessment: Evaluate various betting scenarios and analyze results with ease.
- Efficiency Booster: Streamline the process by avoiding the creation of intricate betting models from the ground up.
How It Works
- Download: Get the pre-prepared Excel file featuring Gambling.com Group Limited’s (GAMB) financial data.
- Customize: Modify projections, such as revenue growth, EBITDA %, and WACC.
- Update Automatically: The intrinsic value and NPV calculations refresh in real-time.
- Test Scenarios: Develop various forecasts and instantly compare results.
- Make Decisions: Utilize the valuation outcomes to inform your investment strategy.
Why Choose This Calculator for Gambling.com Group Limited (GAMB)?
- All-in-One Solution: Combines DCF, WACC, and financial ratio analyses tailored for the gaming industry.
- Flexible Inputs: Modify yellow-highlighted cells to explore different financial scenarios.
- In-Depth Analysis: Automatically computes Gambling.com’s intrinsic value and Net Present Value.
- Preloaded Information: Historical and projected data provide reliable benchmarks for evaluation.
- High-Quality Standards: Perfect for financial analysts, investors, and gaming industry consultants.
Who Should Use This Product?
- Individual Investors: Gain insights to make informed decisions about buying or selling Gambling.com Group Limited (GAMB) stock.
- Financial Analysts: Enhance valuation processes with comprehensive financial models tailored for Gambling.com Group Limited (GAMB).
- Consultants: Provide clients with expert valuation insights related to the online gambling industry quickly and accurately.
- Business Owners: Learn how companies like Gambling.com Group Limited (GAMB) are valued to inform your own business strategies.
- Finance Students: Explore valuation techniques using real-world data from the gambling sector, including Gambling.com Group Limited (GAMB).
What the Template Contains
- Historical Data: Includes Gambling.com Group Limited’s past financials and baseline forecasts.
- DCF and Levered DCF Models: Detailed templates to calculate Gambling.com Group Limited’s intrinsic value.
- WACC Sheet: Pre-built calculations for Weighted Average Cost of Capital.
- Editable Inputs: Modify key drivers like growth rates, EBITDA %, and CAPEX assumptions.
- Quarterly and Annual Statements: A complete breakdown of Gambling.com Group Limited’s financials.
- Interactive Dashboard: Visualize valuation results and projections dynamically.
Disclaimer
All information, articles, and product details provided on this website are for general informational and educational purposes only. We do not claim any ownership over, nor do we intend to infringe upon, any trademarks, copyrights, logos, brand names, or other intellectual property mentioned or depicted on this site. Such intellectual property remains the property of its respective owners, and any references here are made solely for identification or informational purposes, without implying any affiliation, endorsement, or partnership.
We make no representations or warranties, express or implied, regarding the accuracy, completeness, or suitability of any content or products presented. Nothing on this website should be construed as legal, tax, investment, financial, medical, or other professional advice. In addition, no part of this site—including articles or product references—constitutes a solicitation, recommendation, endorsement, advertisement, or offer to buy or sell any securities, franchises, or other financial instruments, particularly in jurisdictions where such activity would be unlawful.
All content is of a general nature and may not address the specific circumstances of any individual or entity. It is not a substitute for professional advice or services. Any actions you take based on the information provided here are strictly at your own risk. You accept full responsibility for any decisions or outcomes arising from your use of this website and agree to release us from any liability in connection with your use of, or reliance upon, the content or products found herein.