
|
Generation Bio Co. (GBIO) DCF -Bewertung |
Fully Editable: Tailor To Your Needs In Excel Or Sheets
Professional Design: Trusted, Industry-Standard Templates
Investor-Approved Valuation Models
MAC/PC Compatible, Fully Unlocked
No Expertise Is Needed; Easy To Follow
Generation Bio Co. (GBIO) Bundle
Verbessern Sie Ihre Anlagestrategien mit dem DCF -Taschenrechner der Generation Bio Co. (GBIO)! Tauchen Sie in authentische Finanzdaten ein, passen Sie Wachstumsprojektionen und -kosten an und beobachten Sie sofort, wie sich diese Modifikationen auf den inneren Wert der Generation Bio Co. (GBIO) auswirken.
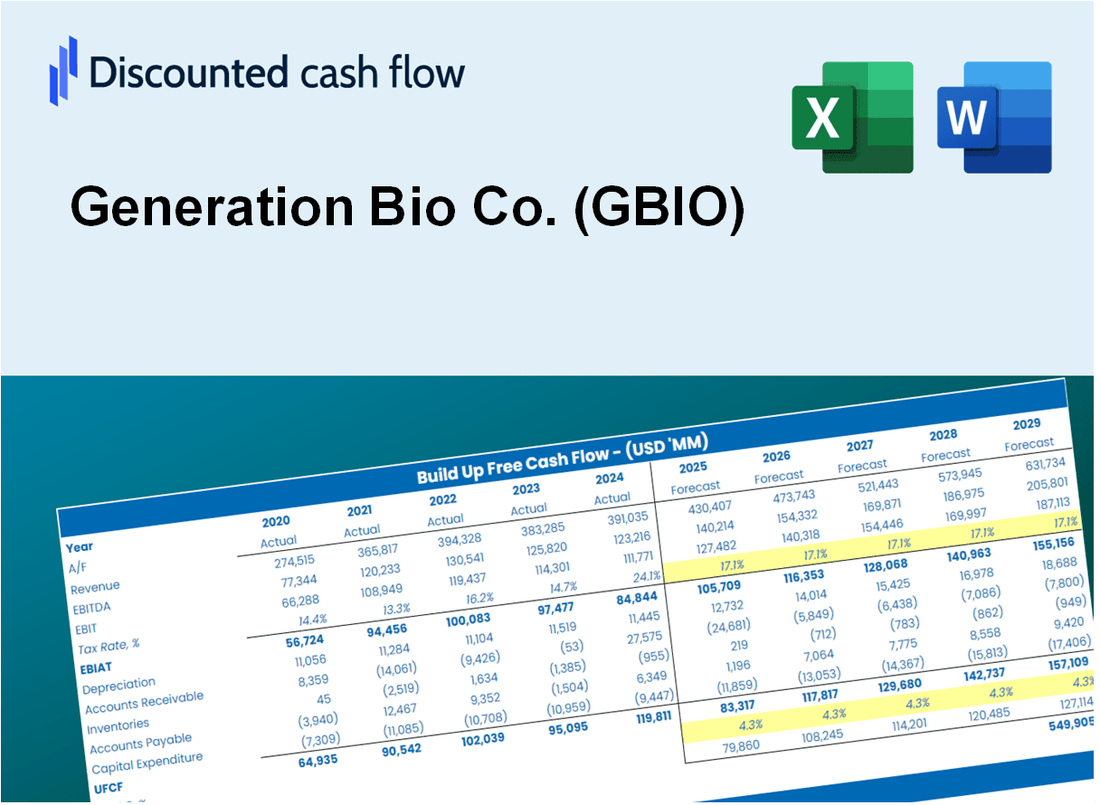
Discounted Cash Flow (DCF) - (USD MM)
| Year | AY1 2020 |
AY2 2021 |
AY3 2022 |
AY4 2023 |
AY5 2024 |
FY1 2025 |
FY2 2026 |
FY3 2027 |
FY4 2028 |
FY5 2029 |
|---|---|---|---|---|---|---|---|---|---|---|
| Revenue | .0 | .0 | .0 | 5.9 | 19.9 | 24.9 | 31.1 | 38.9 | 48.6 | 60.7 |
| Revenue Growth, % | 0 | 0 | 0 | 0 | 236.92 | 25 | 25 | 25 | 25 | 25 |
| EBITDA | -77.1 | -114.6 | -136.1 | -133.3 | -74.3 | 5.0 | 6.2 | 7.8 | 9.7 | 12.1 |
| EBITDA, % | 100 | 100 | 100 | -2257.79 | -373.33 | 20 | 20 | 20 | 20 | 20 |
| Depreciation | 3.4 | 4.5 | 5.1 | 5.3 | 4.9 | 20.6 | 25.7 | 32.2 | 40.2 | 50.3 |
| Depreciation, % | 100 | 100 | 100 | 89.14 | 24.79 | 82.79 | 82.79 | 82.79 | 82.79 | 82.79 |
| EBIT | -80.5 | -119.1 | -141.2 | -138.6 | -79.2 | 5.0 | 6.2 | 7.8 | 9.7 | 12.1 |
| EBIT, % | 100 | 100 | 100 | -2346.93 | -398.11 | 20 | 20 | 20 | 20 | 20 |
| Total Cash | 262.3 | 375.1 | 279.1 | 264.4 | 185.2 | 24.9 | 31.1 | 38.9 | 48.6 | 60.7 |
| Total Cash, percent | .0 | .0 | .0 | .0 | .0 | .0 | .0 | .0 | .0 | .0 |
| Account Receivables | .0 | .0 | .7 | 4.1 | 1.6 | 18.8 | 23.5 | 29.4 | 36.7 | 45.9 |
| Account Receivables, % | 100 | 100 | 100 | 70.26 | 7.84 | 75.62 | 75.62 | 75.62 | 75.62 | 75.62 |
| Inventories | .0 | .0 | .0 | .0 | .0 | 14.9 | 18.6 | 23.3 | 29.1 | 36.4 |
| Inventories, % | 100 | 100 | 100 | 0 | 0 | 60 | 60 | 60 | 60 | 60 |
| Accounts Payable | .3 | 2.0 | .7 | 2.3 | 1.4 | 17.2 | 21.6 | 26.9 | 33.7 | 42.1 |
| Accounts Payable, % | 100 | 100 | 100 | 39.74 | 7.08 | 69.36 | 69.36 | 69.36 | 69.36 | 69.36 |
| Capital Expenditure | -5.5 | -6.0 | -8.8 | -7.4 | -2.4 | -5.6 | -7.0 | -8.7 | -10.9 | -13.6 |
| Capital Expenditure, % | 100 | 100 | 100 | -125.29 | -12.07 | -22.41 | -22.41 | -22.41 | -22.41 | -22.41 |
| Tax Rate, % | 0 | 0 | 0 | 0 | 0 | 0 | 0 | 0 | 0 | 0 |
| EBITAT | -80.5 | -119.1 | -141.2 | -138.6 | -79.2 | 5.0 | 6.2 | 7.8 | 9.7 | 12.1 |
| Depreciation | ||||||||||
| Changes in Account Receivables | ||||||||||
| Changes in Inventories | ||||||||||
| Changes in Accounts Payable | ||||||||||
| Capital Expenditure | ||||||||||
| UFCF | -82.3 | -118.8 | -146.9 | -142.5 | -75.0 | 3.7 | 20.9 | 26.1 | 32.6 | 40.7 |
| WACC, % | 6.32 | 6.32 | 6.32 | 6.32 | 6.32 | 6.32 | 6.32 | 6.32 | 6.32 | 6.32 |
| PV UFCF | ||||||||||
| SUM PV UFCF | 99.1 | |||||||||
| Long Term Growth Rate, % | 2.00 | |||||||||
| Free cash flow (T + 1) | 42 | |||||||||
| Terminal Value | 962 | |||||||||
| Present Terminal Value | 708 | |||||||||
| Enterprise Value | 807 | |||||||||
| Net Debt | 17 | |||||||||
| Equity Value | 790 | |||||||||
| Diluted Shares Outstanding, MM | 7 | |||||||||
| Equity Value Per Share | 118.53 |
What You Will Receive
- Pre-Filled Financial Model: Generation Bio Co.’s (GBIO) actual data supports accurate DCF valuation.
- Comprehensive Forecast Control: Modify revenue growth, profit margins, WACC, and other essential drivers.
- Real-Time Calculations: Instant updates allow you to view results as you adjust inputs.
- Professional-Grade Template: A polished Excel file crafted for high-quality valuation presentations.
- Customizable and Reusable: Designed for adaptability, enabling repeated use for in-depth forecasts.
Key Features
- 🔍 Real-Life GBIO Financials: Pre-filled historical and projected data for Generation Bio Co.
- ✏️ Fully Customizable Inputs: Adjust all critical parameters (yellow cells) like WACC, growth %, and tax rates.
- 📊 Professional DCF Valuation: Built-in formulas calculate Generation Bio’s intrinsic value using the Discounted Cash Flow method.
- ⚡ Instant Results: Visualize Generation Bio’s valuation instantly after making changes.
- Scenario Analysis: Test and compare outcomes for various financial assumptions side-by-side.
How It Works
- Download the Template: Gain immediate access to the Excel-based GBIO DCF Calculator.
- Input Your Assumptions: Modify the yellow-highlighted cells for growth rates, WACC, margins, and other variables.
- Instant Calculations: The model automatically computes Generation Bio Co.’s intrinsic value.
- Test Scenarios: Experiment with various assumptions to assess potential changes in valuation.
- Analyze and Decide: Leverage the results to inform your investment or financial analysis.
Why Choose This Calculator for Generation Bio Co. (GBIO)?
- Designed for Experts: A sophisticated tool tailored for analysts, CFOs, and consultants in the biotech sector.
- Comprehensive Data: Generation Bio's historical and projected financials are preloaded for precise analysis.
- Flexible Scenario Analysis: Effortlessly simulate various forecasts and assumptions.
- Clear Results: Automatically computes intrinsic value, NPV, and essential metrics.
- User-Friendly: Step-by-step guidance ensures a smooth user experience.
Who Should Use This Product?
- Investors: Evaluate Generation Bio Co.'s (GBIO) market potential before making investment decisions.
- CFOs and Financial Analysts: Optimize valuation methodologies and assess financial forecasts for GBIO.
- Startup Founders: Understand the valuation strategies of biotechnology firms like Generation Bio Co. (GBIO).
- Consultants: Create detailed valuation assessments for clients in the biotech sector.
- Students and Educators: Utilize current data to learn and teach valuation practices relevant to the biotech industry.
What the Template Contains
- Operating and Balance Sheet Data: Pre-filled Generation Bio Co. (GBIO) historical data and forecasts, including revenue, EBITDA, EBIT, and capital expenditures.
- WACC Calculation: A dedicated sheet for Weighted Average Cost of Capital (WACC), including parameters like Beta, risk-free rate, and share price.
- DCF Valuation (Unlevered and Levered): Editable Discounted Cash Flow models showing intrinsic value with detailed calculations.
- Financial Statements: Pre-loaded financial statements (annual and quarterly) to support analysis.
- Key Ratios: Includes profitability, leverage, and efficiency ratios for Generation Bio Co. (GBIO).
- Dashboard and Charts: Visual summary of valuation outputs and assumptions to analyze results easily.
Disclaimer
All information, articles, and product details provided on this website are for general informational and educational purposes only. We do not claim any ownership over, nor do we intend to infringe upon, any trademarks, copyrights, logos, brand names, or other intellectual property mentioned or depicted on this site. Such intellectual property remains the property of its respective owners, and any references here are made solely for identification or informational purposes, without implying any affiliation, endorsement, or partnership.
We make no representations or warranties, express or implied, regarding the accuracy, completeness, or suitability of any content or products presented. Nothing on this website should be construed as legal, tax, investment, financial, medical, or other professional advice. In addition, no part of this site—including articles or product references—constitutes a solicitation, recommendation, endorsement, advertisement, or offer to buy or sell any securities, franchises, or other financial instruments, particularly in jurisdictions where such activity would be unlawful.
All content is of a general nature and may not address the specific circumstances of any individual or entity. It is not a substitute for professional advice or services. Any actions you take based on the information provided here are strictly at your own risk. You accept full responsibility for any decisions or outcomes arising from your use of this website and agree to release us from any liability in connection with your use of, or reliance upon, the content or products found herein.