
|
Gruppe Bruxelles Lambert SA (GBLB.BR) DCF -Bewertung |
Fully Editable: Tailor To Your Needs In Excel Or Sheets
Professional Design: Trusted, Industry-Standard Templates
Investor-Approved Valuation Models
MAC/PC Compatible, Fully Unlocked
No Expertise Is Needed; Easy To Follow
Groupe Bruxelles Lambert SA (GBLB.BR) Bundle
Optimieren Sie Ihre Zeit und steigern Sie die Präzision mit unserem (GBLBBR) DCF -Taschenrechner! Mithilfe realer Daten von Groupe Bruxelles Lambert SA und anpassbaren Annahmen können Sie dieses Tool wie ein erfahrener Investor prognostizieren, analysieren und value (GBLBBR).
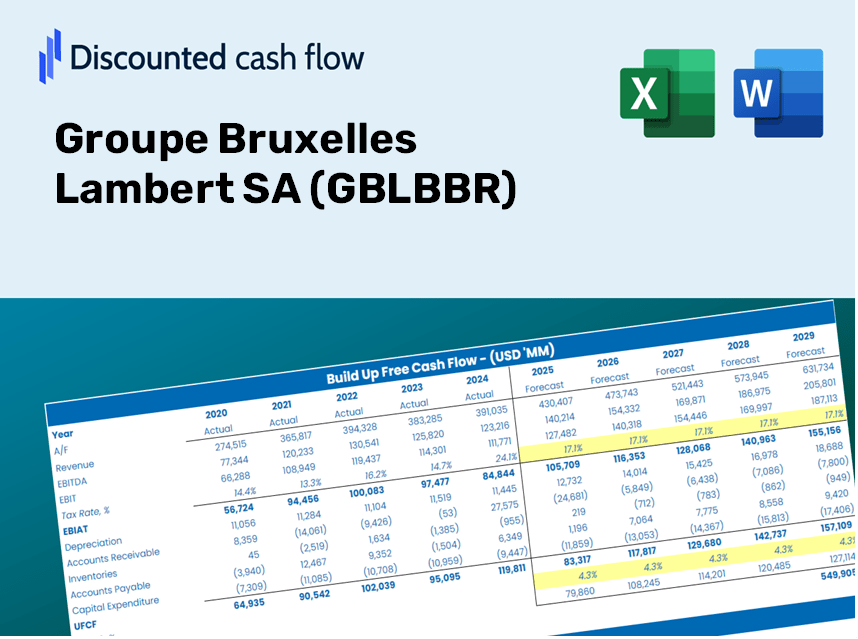
Discounted Cash Flow (DCF) - (USD MM)
| Year | AY1 2020 |
AY2 2021 |
AY3 2022 |
AY4 2023 |
AY5 2024 |
FY1 2025 |
FY2 2026 |
FY3 2027 |
FY4 2028 |
FY5 2029 |
|---|---|---|---|---|---|---|---|---|---|---|
| Revenue | 6,292.4 | 7,213.8 | 8,565.6 | 6,749.5 | 6,435.6 | 6,556.7 | 6,680.2 | 6,805.9 | 6,934.0 | 7,064.5 |
| Revenue Growth, % | 0 | 14.64 | 18.74 | -21.2 | -4.65 | 1.88 | 1.88 | 1.88 | 1.88 | 1.88 |
| EBITDA | 1,272.3 | 1,138.8 | 642.0 | 1,489.0 | 961.4 | 1,055.6 | 1,075.5 | 1,095.8 | 1,116.4 | 1,137.4 |
| EBITDA, % | 20.22 | 15.79 | 7.5 | 22.06 | 14.94 | 16.1 | 16.1 | 16.1 | 16.1 | 16.1 |
| Depreciation | 539.0 | 567.4 | 676.5 | 525.9 | 557.6 | 534.8 | 544.9 | 555.2 | 565.6 | 576.3 |
| Depreciation, % | 8.57 | 7.87 | 7.9 | 7.79 | 8.66 | 8.16 | 8.16 | 8.16 | 8.16 | 8.16 |
| EBIT | 733.3 | 571.4 | -34.5 | 963.1 | 403.8 | 520.8 | 530.6 | 540.6 | 550.8 | 561.1 |
| EBIT, % | 11.65 | 7.92 | -0.40277 | 14.27 | 6.27 | 7.94 | 7.94 | 7.94 | 7.94 | 7.94 |
| Total Cash | 1,761.2 | 3,432.4 | 2,676.3 | 2,630.2 | 3,570.4 | 2,639.3 | 2,688.9 | 2,739.5 | 2,791.1 | 2,843.7 |
| Total Cash, percent | .0 | .0 | .0 | .0 | .0 | .0 | .0 | .0 | .0 | .0 |
| Account Receivables | 912.3 | 1,019.7 | 1,108.7 | 600.6 | 637.1 | 791.7 | 806.6 | 821.8 | 837.3 | 853.0 |
| Account Receivables, % | 14.5 | 14.14 | 12.94 | 8.9 | 9.9 | 12.08 | 12.08 | 12.08 | 12.08 | 12.08 |
| Inventories | 704.0 | 1,103.8 | 1,210.6 | 1,172.8 | 1,105.7 | 985.9 | 1,004.4 | 1,023.3 | 1,042.6 | 1,062.2 |
| Inventories, % | 11.19 | 15.3 | 14.13 | 17.38 | 17.18 | 15.04 | 15.04 | 15.04 | 15.04 | 15.04 |
| Accounts Payable | 603.8 | 865.8 | 857.4 | 571.5 | 630.0 | 653.9 | 666.2 | 678.7 | 691.5 | 704.5 |
| Accounts Payable, % | 9.6 | 12 | 10.01 | 8.47 | 9.79 | 9.97 | 9.97 | 9.97 | 9.97 | 9.97 |
| Capital Expenditure | -360.4 | -453.6 | -635.3 | -566.3 | -582.2 | -483.5 | -492.6 | -501.9 | -511.3 | -520.9 |
| Capital Expenditure, % | -5.73 | -6.29 | -7.42 | -8.39 | -9.05 | -7.37 | -7.37 | -7.37 | -7.37 | -7.37 |
| Tax Rate, % | 14.65 | 14.65 | 14.65 | 14.65 | 14.65 | 14.65 | 14.65 | 14.65 | 14.65 | 14.65 |
| EBITAT | 562.1 | 474.3 | -45.5 | 3,321.2 | 344.7 | 463.5 | 472.3 | 481.2 | 490.2 | 499.4 |
| Depreciation | ||||||||||
| Changes in Account Receivables | ||||||||||
| Changes in Inventories | ||||||||||
| Changes in Accounts Payable | ||||||||||
| Capital Expenditure | ||||||||||
| UFCF | -271.8 | 342.9 | -208.5 | 3,540.8 | 409.2 | 504.0 | 503.4 | 512.9 | 522.6 | 532.4 |
| WACC, % | 5.4 | 5.54 | 5.9 | 5.9 | 5.59 | 5.67 | 5.67 | 5.67 | 5.67 | 5.67 |
| PV UFCF | ||||||||||
| SUM PV UFCF | 2,186.0 | |||||||||
| Long Term Growth Rate, % | 2.00 | |||||||||
| Free cash flow (T + 1) | 543 | |||||||||
| Terminal Value | 14,815 | |||||||||
| Present Terminal Value | 11,247 | |||||||||
| Enterprise Value | 13,433 | |||||||||
| Net Debt | 6,858 | |||||||||
| Equity Value | 6,575 | |||||||||
| Diluted Shares Outstanding, MM | 138 | |||||||||
| Equity Value Per Share | 47.71 |
What You Will Receive
- Accurate GBLBBR Financial Data: Pre-filled with Groupe Bruxelles Lambert’s historical and projected data for thorough analysis.
- Completely Customizable Template: Easily adjust key inputs such as revenue growth, WACC, and EBITDA %.
- Real-Time Calculations: Instantly see the intrinsic value of GBLBBR update based on your modifications.
- Professional Valuation Tool: Crafted for investors, analysts, and consultants aiming for precise DCF outcomes.
- User-Friendly Interface: Intuitive layout and straightforward instructions suitable for all skill levels.
Key Features
- Comprehensive DCF Calculator: Features detailed unlevered and levered DCF valuation frameworks.
- WACC Calculator: Ready-to-use Weighted Average Cost of Capital template with adjustable inputs.
- Customizable Forecast Assumptions: Adjust growth rates, capital expenditures, and discount rates as needed.
- Integrated Financial Ratios: Evaluate profitability, leverage, and efficiency ratios for Groupe Bruxelles Lambert SA (GBLBBR).
- Interactive Dashboard and Charts: Visual outputs present essential valuation metrics for straightforward analysis.
How It Works
- 1. Access the Template: Download and open the Excel file featuring Groupe Bruxelles Lambert SA’s (GBLBBR) preloaded data.
- 2. Modify Assumptions: Adjust key inputs such as growth rates, WACC, and capital expenditures to suit your analysis.
- 3. View Results in Real-Time: The DCF model automatically computes the intrinsic value and NPV based on your inputs.
- 4. Explore Different Scenarios: Evaluate multiple forecasts to assess various valuation outcomes for (GBLBBR).
- 5. Present with Assurance: Deliver professional valuation insights that bolster your decision-making process for Groupe Bruxelles Lambert SA (GBLBBR).
Why Opt for This Calculator?
- User-Friendly and Accessible: Crafted for both novices and seasoned professionals.
- Customizable Inputs: Easily adjust assumptions to tailor your analysis.
- Real-Time Updates: Observe immediate changes in GBLBBR's valuation as you modify inputs.
- Pre-Configured: Comes with GBLBBR's actual financial data for swift evaluations.
- Endorsed by Industry Experts: Trusted by investors and analysts for informed decision-making.
Who Can Benefit from This Product?
- Investors: Evaluate the valuation of Groupe Bruxelles Lambert SA (GBLBBR) prior to making stock transactions.
- CFOs and Financial Analysts: Optimize valuation workflows and assess forecasts.
- Startup Founders: Discover how leading public firms like Groupe Bruxelles Lambert SA (GBLBBR) are appraised.
- Consultants: Provide comprehensive valuation reports for your clients.
- Students and Educators: Utilize real-world data to practice and instruct on valuation methodologies.
Contents of the Template
- Historical Data: Presents GBLBBR's previous financials and foundational forecasts.
- DCF and Levered DCF Models: Comprehensive templates to assess GBLBBR's intrinsic value.
- WACC Sheet: Pre-calibrated calculations for Weighted Average Cost of Capital.
- Editable Inputs: Adjust key variables such as growth rates, EBITDA %, and CAPEX assumptions.
- Quarterly and Annual Statements: An extensive overview of GBLBBR's financials.
- Interactive Dashboard: Dynamically visualize valuation outcomes and forecasts.
Disclaimer
All information, articles, and product details provided on this website are for general informational and educational purposes only. We do not claim any ownership over, nor do we intend to infringe upon, any trademarks, copyrights, logos, brand names, or other intellectual property mentioned or depicted on this site. Such intellectual property remains the property of its respective owners, and any references here are made solely for identification or informational purposes, without implying any affiliation, endorsement, or partnership.
We make no representations or warranties, express or implied, regarding the accuracy, completeness, or suitability of any content or products presented. Nothing on this website should be construed as legal, tax, investment, financial, medical, or other professional advice. In addition, no part of this site—including articles or product references—constitutes a solicitation, recommendation, endorsement, advertisement, or offer to buy or sell any securities, franchises, or other financial instruments, particularly in jurisdictions where such activity would be unlawful.
All content is of a general nature and may not address the specific circumstances of any individual or entity. It is not a substitute for professional advice or services. Any actions you take based on the information provided here are strictly at your own risk. You accept full responsibility for any decisions or outcomes arising from your use of this website and agree to release us from any liability in connection with your use of, or reliance upon, the content or products found herein.