
|
Grosvenor Capital Management, L.P. (GCMG) DCF -Bewertung |
Fully Editable: Tailor To Your Needs In Excel Or Sheets
Professional Design: Trusted, Industry-Standard Templates
Investor-Approved Valuation Models
MAC/PC Compatible, Fully Unlocked
No Expertise Is Needed; Easy To Follow
Grosvenor Capital Management, L.P. (GCMG) Bundle
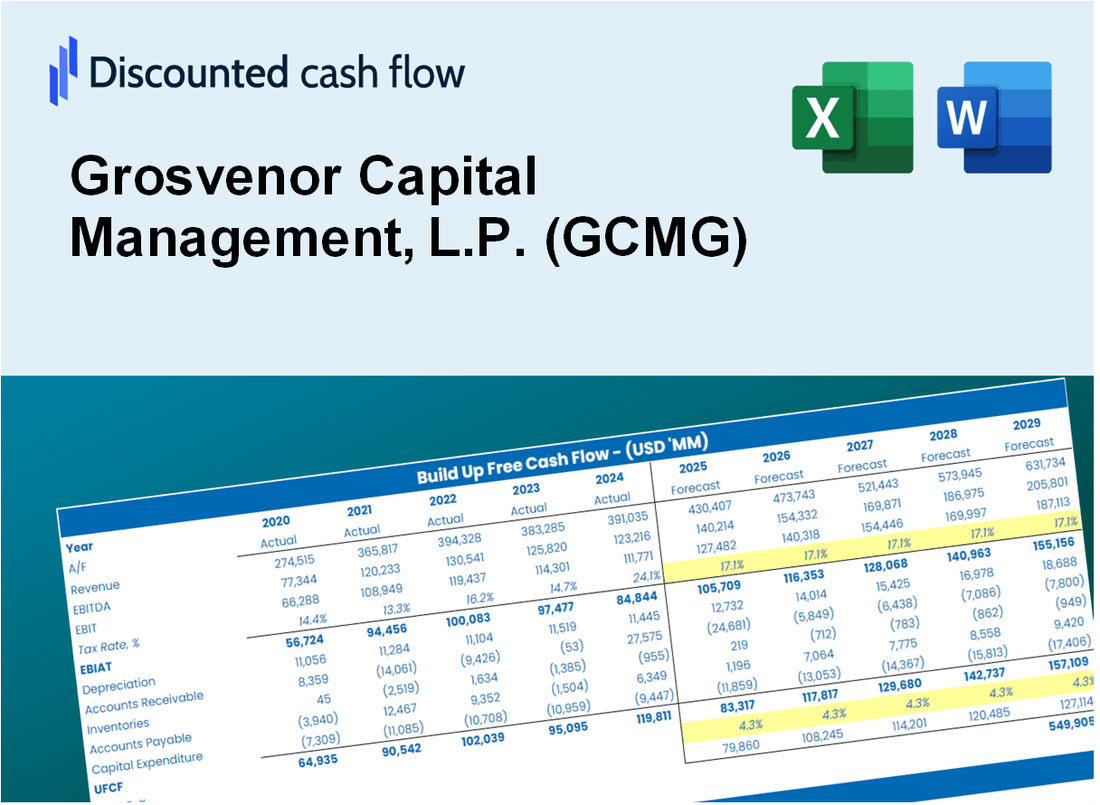
Bewerten Sie Grosvenor Capital Management, die finanziellen Aussichten von L.P. wie ein Experte! Dieser (GCMG) DCF-Taschenrechner liefert vorgefüllte Finanzdaten und ermöglicht es Ihnen, das Umsatzwachstum, WACC, Margen und andere wichtige Annahmen leicht zu ändern, um sich an Ihren Projektionen anzupassen.
Discounted Cash Flow (DCF) - (USD MM)
| Year | AY1 2020 |
AY2 2021 |
AY3 2022 |
AY4 2023 |
AY5 2024 |
FY1 2025 |
FY2 2026 |
FY3 2027 |
FY4 2028 |
FY5 2029 |
|---|---|---|---|---|---|---|---|---|---|---|
| Revenue | 433.1 | 577.6 | 452.5 | 452.0 | 523.5 | 559.3 | 597.6 | 638.6 | 682.3 | 729.0 |
| Revenue Growth, % | 0 | 33.34 | -21.65 | -0.11712 | 15.82 | 6.85 | 6.85 | 6.85 | 6.85 | 6.85 |
| EBITDA | -45.4 | 177.2 | 116.3 | 4.9 | 77.6 | 69.1 | 73.9 | 78.9 | 84.3 | 90.1 |
| EBITDA, % | -10.49 | 30.67 | 25.69 | 1.09 | 14.83 | 12.36 | 12.36 | 12.36 | 12.36 | 12.36 |
| Depreciation | 9.8 | 4.0 | 3.9 | 2.7 | 3.3 | 5.6 | 6.0 | 6.4 | 6.9 | 7.4 |
| Depreciation, % | 2.27 | 0.69603 | 0.85212 | 0.59648 | 0.63422 | 1.01 | 1.01 | 1.01 | 1.01 | 1.01 |
| EBIT | -55.3 | 173.1 | 112.4 | 2.2 | 74.3 | 63.5 | 67.8 | 72.5 | 77.4 | 82.7 |
| EBIT, % | -12.76 | 29.98 | 24.84 | 0.4936 | 14.2 | 11.35 | 11.35 | 11.35 | 11.35 | 11.35 |
| Total Cash | 198.1 | 96.2 | 85.2 | 44.4 | 89.5 | 120.9 | 129.2 | 138.1 | 147.5 | 157.6 |
| Total Cash, percent | .0 | .0 | .0 | .0 | .0 | .0 | .0 | .0 | .0 | .0 |
| Account Receivables | 95.3 | 125.1 | 48.3 | 65.9 | 99.4 | 98.3 | 105.1 | 112.3 | 120.0 | 128.2 |
| Account Receivables, % | 22 | 21.65 | 10.68 | 14.59 | 18.99 | 17.58 | 17.58 | 17.58 | 17.58 | 17.58 |
| Inventories | .0 | .0 | .0 | .0 | .0 | .0 | .0 | .0 | .0 | .0 |
| Inventories, % | 0 | 0 | 0 | 0 | 0 | 0 | 0 | 0 | 0 | 0 |
| Accounts Payable | .0 | .0 | .0 | .0 | .0 | .0 | .0 | .0 | .0 | .0 |
| Accounts Payable, % | 0 | 0 | 0 | 0 | 0 | 0 | 0 | 0 | 0 | 0 |
| Capital Expenditure | -1.3 | -.6 | -.8 | -3.8 | -16.7 | -5.1 | -5.5 | -5.9 | -6.3 | -6.7 |
| Capital Expenditure, % | -0.30198 | -0.09990235 | -0.17281 | -0.83255 | -3.2 | -0.9206 | -0.9206 | -0.9206 | -0.9206 | -0.9206 |
| Tax Rate, % | 62.73 | 62.73 | 62.73 | 62.73 | 62.73 | 62.73 | 62.73 | 62.73 | 62.73 | 62.73 |
| EBITAT | 2.8 | 24.3 | 25.0 | -1.3 | 27.7 | 9.3 | 10.0 | 10.7 | 11.4 | 12.2 |
| Depreciation | ||||||||||
| Changes in Account Receivables | ||||||||||
| Changes in Inventories | ||||||||||
| Changes in Accounts Payable | ||||||||||
| Capital Expenditure | ||||||||||
| UFCF | -83.9 | -2.1 | 104.8 | -20.0 | -19.2 | 10.9 | 3.8 | 4.0 | 4.3 | 4.6 |
| WACC, % | 6.52 | 6.61 | 6.67 | 6.52 | 6.77 | 6.62 | 6.62 | 6.62 | 6.62 | 6.62 |
| PV UFCF | ||||||||||
| SUM PV UFCF | 23.5 | |||||||||
| Long Term Growth Rate, % | 2.00 | |||||||||
| Free cash flow (T + 1) | 5 | |||||||||
| Terminal Value | 102 | |||||||||
| Present Terminal Value | 74 | |||||||||
| Enterprise Value | 97 | |||||||||
| Net Debt | 396 | |||||||||
| Equity Value | -299 | |||||||||
| Diluted Shares Outstanding, MM | 191 | |||||||||
| Equity Value Per Share | -1.57 |
What You Will Receive
- Comprehensive Financial Model: GCMG’s actual data facilitates accurate DCF valuation.
- Complete Forecast Control: Modify revenue growth, margins, WACC, and other essential drivers.
- Real-Time Calculations: Automatic updates provide immediate insights as you adjust parameters.
- Professional-Grade Template: A polished Excel file crafted for expert-level valuation.
- Flexible and Reusable: Designed for adaptability, enabling repeated use for in-depth forecasts.
Key Features
- Comprehensive Data Access: GCMG’s extensive historical performance metrics and market analysis.
- Customizable Parameters: Adjust investment strategies, risk assessments, and return projections.
- Real-Time Analytics: Monitor GCMG’s asset valuations and market trends instantly.
- Intuitive Visualizations: Interactive dashboards showcase investment performance and critical indicators.
- Designed for Professionals: A robust platform tailored for asset managers, investors, and financial analysts.
How It Works
- 1. Access the Template: Download and open the Excel file featuring Grosvenor Capital Management's (GCMG) preloaded data.
- 2. Adjust Assumptions: Modify critical inputs such as growth rates, WACC, and capital expenditures.
- 3. Analyze Results Immediately: The DCF model automatically computes intrinsic value and NPV.
- 4. Explore Scenarios: Evaluate various forecasts to assess different valuation results.
- 5. Present with Assurance: Deliver expert valuation insights to guide your strategic decisions.
Why Choose Grosvenor Capital Management (GCMG)?
- Expertise: Leverage industry-leading insights for informed investment decisions.
- Customizable: Tailor investment strategies to meet individual client needs.
- Efficiency: Streamlined processes to enhance investment performance.
- Institutional Quality: Built on a foundation of institutional-grade investment practices.
- Accessible: Designed for both seasoned investors and newcomers to the market.
Who Should Use This Product?
- Institutional Investors: Develop comprehensive investment strategies using insights from Grosvenor Capital Management, L.P. (GCMG).
- Asset Managers: Evaluate fund performance and asset allocation with GCMG's analytical tools.
- Financial Consultants: Offer clients tailored investment advice based on GCMG's market expertise.
- Students and Academics: Leverage real investment data to enhance learning in finance and investment courses.
- Market Analysts: Gain a deeper understanding of alternative investment strategies through GCMG's research.
What the Template Contains
- Preloaded GCMG Data: Historical and projected financial data, including revenue, EBIT, and capital expenditures.
- DCF and WACC Models: Professional-grade sheets for calculating intrinsic value and Weighted Average Cost of Capital.
- Editable Inputs: Yellow-highlighted cells for adjusting revenue growth, tax rates, and discount rates.
- Financial Statements: Comprehensive annual and quarterly financials for deeper analysis.
- Key Ratios: Profitability, leverage, and efficiency ratios to evaluate performance.
- Dashboard and Charts: Visual summaries of valuation outcomes and assumptions.
Disclaimer
All information, articles, and product details provided on this website are for general informational and educational purposes only. We do not claim any ownership over, nor do we intend to infringe upon, any trademarks, copyrights, logos, brand names, or other intellectual property mentioned or depicted on this site. Such intellectual property remains the property of its respective owners, and any references here are made solely for identification or informational purposes, without implying any affiliation, endorsement, or partnership.
We make no representations or warranties, express or implied, regarding the accuracy, completeness, or suitability of any content or products presented. Nothing on this website should be construed as legal, tax, investment, financial, medical, or other professional advice. In addition, no part of this site—including articles or product references—constitutes a solicitation, recommendation, endorsement, advertisement, or offer to buy or sell any securities, franchises, or other financial instruments, particularly in jurisdictions where such activity would be unlawful.
All content is of a general nature and may not address the specific circumstances of any individual or entity. It is not a substitute for professional advice or services. Any actions you take based on the information provided here are strictly at your own risk. You accept full responsibility for any decisions or outcomes arising from your use of this website and agree to release us from any liability in connection with your use of, or reliance upon, the content or products found herein.