
|
DCF -Bewertung der Green Dot Corporation (GDOT) |
Fully Editable: Tailor To Your Needs In Excel Or Sheets
Professional Design: Trusted, Industry-Standard Templates
Investor-Approved Valuation Models
MAC/PC Compatible, Fully Unlocked
No Expertise Is Needed; Easy To Follow
Green Dot Corporation (GDOT) Bundle
Verbessern Sie Ihre Anlagestrategien mit dem DCF -Taschenrechner der Green Dot Corporation (GDOT)! Tauchen Sie in authentische Finanzdaten für Apple ein, passen Sie die Wachstumsvorhersagen und -kosten an und stellen Sie sich sofort vor, wie sich diese Anpassungen auf den inneren Wert der Green Dot Corporation (GDOT) auswirken.
What You Will Get
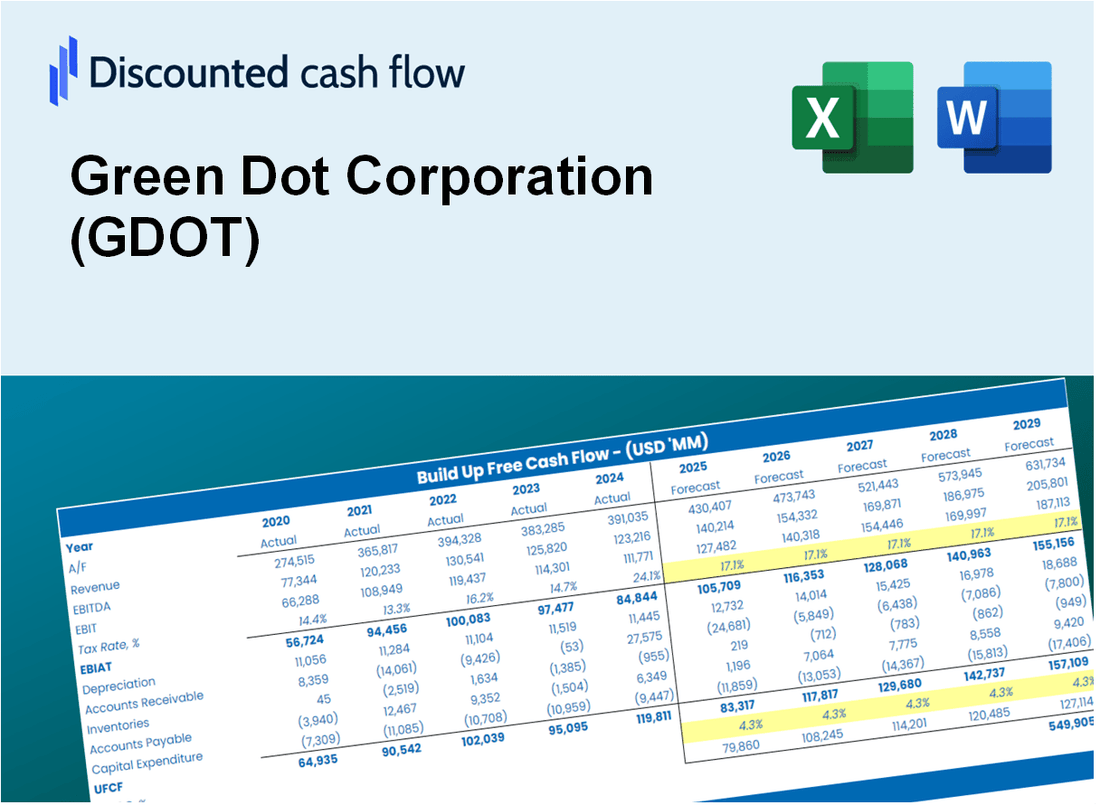
- Editable Excel Template: A fully customizable Excel-based DCF Calculator featuring pre-filled real GDOT financials.
- Real-World Data: Historical data and forward-looking estimates (as indicated in the yellow cells).
- Forecast Flexibility: Adjust forecast assumptions such as revenue growth, EBITDA %, and WACC.
- Automatic Calculations: Instantly observe how your inputs influence Green Dot Corporation’s valuation.
- Professional Tool: Designed for investors, CFOs, consultants, and financial analysts.
- User-Friendly Design: Organized for clarity and ease of use, complete with step-by-step instructions.
Key Features
- Real-Time GDOT Data: Pre-loaded with Green Dot Corporation’s historical financials and future projections.
- Comprehensive Customization: Modify revenue growth rates, profit margins, WACC, tax rates, and capital expenditures.
- Interactive Valuation Model: Automatically recalculates Net Present Value (NPV) and intrinsic value based on your adjustments.
- Scenario Analysis: Develop various forecasting scenarios to evaluate different valuation results.
- Intuitive Interface: Designed to be straightforward and accessible for both professionals and novices.
How It Works
- Download: Obtain the pre-configured Excel file containing Green Dot Corporation's (GDOT) financial information.
- Customize: Modify projections, including revenue growth, EBITDA %, and WACC.
- Update Automatically: The intrinsic value and NPV calculations refresh in real-time.
- Test Scenarios: Generate various forecasts and evaluate results immediately.
- Make Decisions: Utilize the valuation findings to inform your investment approach.
Why Choose This Calculator for Green Dot Corporation (GDOT)?
- All-in-One Solution: Integrates DCF, WACC, and key financial ratio analyses tailored for Green Dot Corporation.
- Flexible Parameters: Modify the highlighted cells to explore different financial scenarios specific to (GDOT).
- In-Depth Analysis: Automatically computes the intrinsic value and Net Present Value for Green Dot Corporation.
- Rich Data Set: Comes with historical and projected data for accurate financial assessments.
- Expert-Level Precision: Perfect for financial analysts, investors, and business advisors focusing on (GDOT).
Who Should Use This Product?
- Investors: Evaluate Green Dot Corporation’s (GDOT) market position before making investment decisions.
- CFOs and Financial Analysts: Enhance valuation methodologies and assess financial forecasts.
- Startup Founders: Gain insights into the valuation practices of established companies like Green Dot Corporation.
- Consultants: Create detailed valuation reports to support client needs.
- Students and Educators: Utilize actual market data to learn and teach valuation strategies.
What the Template Contains
- Operating and Balance Sheet Data: Pre-filled Green Dot Corporation (GDOT) historical data and forecasts, including revenue, EBITDA, EBIT, and capital expenditures.
- WACC Calculation: A dedicated sheet for Weighted Average Cost of Capital (WACC), including parameters like Beta, risk-free rate, and share price.
- DCF Valuation (Unlevered and Levered): Editable Discounted Cash Flow models showing intrinsic value with detailed calculations.
- Financial Statements: Pre-loaded financial statements (annual and quarterly) to support analysis.
- Key Ratios: Includes profitability, leverage, and efficiency ratios for Green Dot Corporation (GDOT).
- Dashboard and Charts: Visual summary of valuation outputs and assumptions to analyze results easily.
Disclaimer
All information, articles, and product details provided on this website are for general informational and educational purposes only. We do not claim any ownership over, nor do we intend to infringe upon, any trademarks, copyrights, logos, brand names, or other intellectual property mentioned or depicted on this site. Such intellectual property remains the property of its respective owners, and any references here are made solely for identification or informational purposes, without implying any affiliation, endorsement, or partnership.
We make no representations or warranties, express or implied, regarding the accuracy, completeness, or suitability of any content or products presented. Nothing on this website should be construed as legal, tax, investment, financial, medical, or other professional advice. In addition, no part of this site—including articles or product references—constitutes a solicitation, recommendation, endorsement, advertisement, or offer to buy or sell any securities, franchises, or other financial instruments, particularly in jurisdictions where such activity would be unlawful.
All content is of a general nature and may not address the specific circumstances of any individual or entity. It is not a substitute for professional advice or services. Any actions you take based on the information provided here are strictly at your own risk. You accept full responsibility for any decisions or outcomes arising from your use of this website and agree to release us from any liability in connection with your use of, or reliance upon, the content or products found herein.