
|
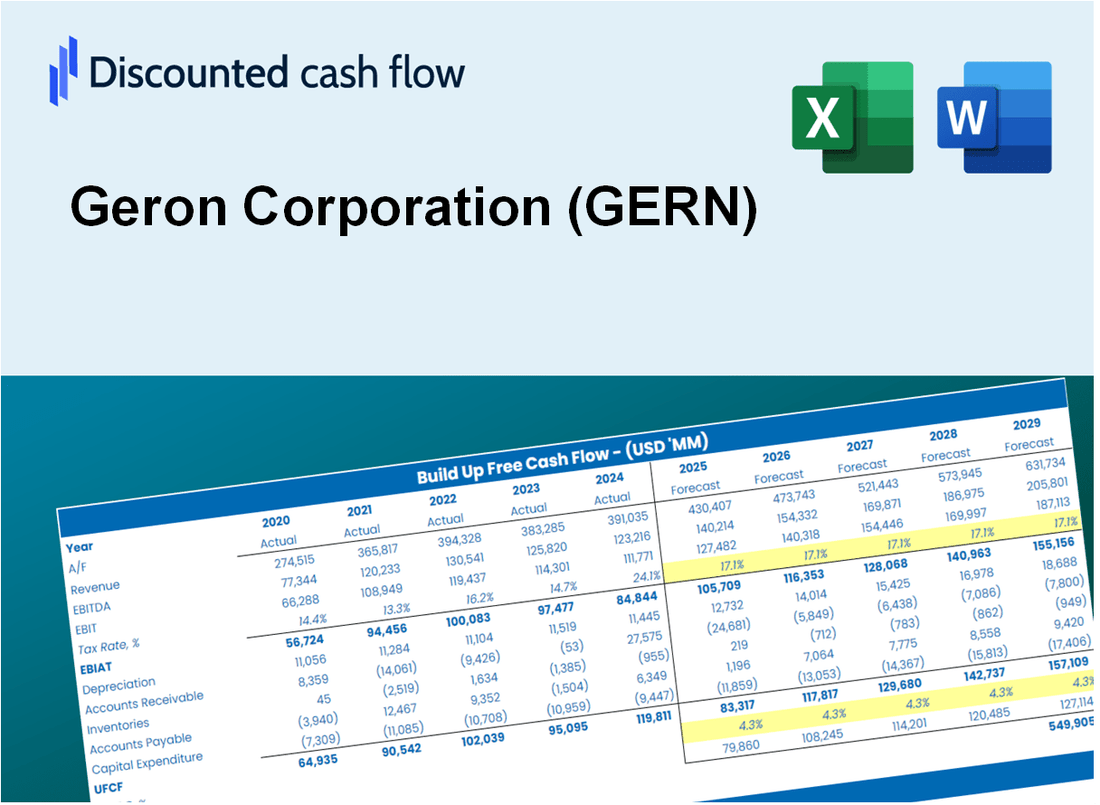
DCF -Bewertung der Geron Corporation (Gern) |
Fully Editable: Tailor To Your Needs In Excel Or Sheets
Professional Design: Trusted, Industry-Standard Templates
Investor-Approved Valuation Models
MAC/PC Compatible, Fully Unlocked
No Expertise Is Needed; Easy To Follow
Geron Corporation (GERN) Bundle
Erwerben Sie die Bewertungsanalyse für Ihre Geron Corporation (GERN) mit unserem ausgefeilten DCF -Taschenrechner! Mit dieser Excel -Vorlage, die mit genauen (Gern-) Daten geladen ist, können Sie Prognosen und Annahmen anpassen, um den inneren Wert der Geron Corporation mit Genauigkeit zu bestimmen.
What You Will Get
- Real Geron Data: Preloaded financials – from revenue to EBIT – based on actual and projected figures.
- Full Customization: Adjust all critical parameters (yellow cells) like WACC, growth %, and tax rates.
- Instant Valuation Updates: Automatic recalculations to analyze the impact of changes on Geron Corporation’s fair value.
- Versatile Excel Template: Tailored for quick edits, scenario testing, and detailed projections.
- Time-Saving and Accurate: Skip building models from scratch while maintaining precision and flexibility.
Key Features
- 🔍 Real-Life GERN Financials: Pre-filled historical and projected data for Geron Corporation (GERN).
- ✏️ Fully Customizable Inputs: Adjust all critical parameters (yellow cells) like WACC, growth %, and tax rates.
- 📊 Professional DCF Valuation: Built-in formulas calculate Geron’s intrinsic value using the Discounted Cash Flow method.
- ⚡ Instant Results: Visualize Geron’s valuation instantly after making changes.
- Scenario Analysis: Test and compare outcomes for various financial assumptions side-by-side.
How It Works
- Step 1: Download the prebuilt Excel template with Geron Corporation’s (GERN) data included.
- Step 2: Explore the pre-filled sheets and understand the key metrics.
- Step 3: Update forecasts and assumptions in the editable yellow cells (WACC, growth, margins).
- Step 4: Instantly view recalculated results, including Geron Corporation’s (GERN) intrinsic value.
- Step 5: Make informed investment decisions or generate reports using the outputs.
Why Choose Geron Corporation (GERN)?
- Innovative Solutions: Cutting-edge research and development in cancer therapeutics.
- Proven Track Record: A history of successful clinical trials and advancements in treatment.
- Commitment to Patients: Focused on improving patient outcomes through targeted therapies.
- Expert Team: Led by experienced professionals in oncology and pharmaceutical development.
- Strong Partnerships: Collaborations with leading institutions enhance research capabilities.
Who Should Use This Product?
- Investors: Evaluate Geron Corporation’s (GERN) valuation prior to making investment decisions.
- CFOs and Financial Analysts: Enhance valuation methodologies and analyze financial forecasts.
- Startup Founders: Understand the valuation strategies of established biotech companies like Geron Corporation.
- Consultants: Create comprehensive valuation reports for your clients focusing on Geron Corporation.
- Students and Educators: Utilize real-time data to teach and apply valuation principles using Geron Corporation as a case study.
What the Template Contains
- Operating and Balance Sheet Data: Pre-filled Geron Corporation (GERN) historical data and forecasts, including revenue, EBITDA, EBIT, and capital expenditures.
- WACC Calculation: A dedicated sheet for Weighted Average Cost of Capital (WACC), including parameters like Beta, risk-free rate, and share price.
- DCF Valuation (Unlevered and Levered): Editable Discounted Cash Flow models showing intrinsic value with detailed calculations.
- Financial Statements: Pre-loaded financial statements (annual and quarterly) to support analysis.
- Key Ratios: Includes profitability, leverage, and efficiency ratios for Geron Corporation (GERN).
- Dashboard and Charts: Visual summary of valuation outputs and assumptions to analyze results easily.
Disclaimer
All information, articles, and product details provided on this website are for general informational and educational purposes only. We do not claim any ownership over, nor do we intend to infringe upon, any trademarks, copyrights, logos, brand names, or other intellectual property mentioned or depicted on this site. Such intellectual property remains the property of its respective owners, and any references here are made solely for identification or informational purposes, without implying any affiliation, endorsement, or partnership.
We make no representations or warranties, express or implied, regarding the accuracy, completeness, or suitability of any content or products presented. Nothing on this website should be construed as legal, tax, investment, financial, medical, or other professional advice. In addition, no part of this site—including articles or product references—constitutes a solicitation, recommendation, endorsement, advertisement, or offer to buy or sell any securities, franchises, or other financial instruments, particularly in jurisdictions where such activity would be unlawful.
All content is of a general nature and may not address the specific circumstances of any individual or entity. It is not a substitute for professional advice or services. Any actions you take based on the information provided here are strictly at your own risk. You accept full responsibility for any decisions or outcomes arising from your use of this website and agree to release us from any liability in connection with your use of, or reliance upon, the content or products found herein.