
|
DCF -Bewertung der Guild Holdings Company (GLLD) |
Fully Editable: Tailor To Your Needs In Excel Or Sheets
Professional Design: Trusted, Industry-Standard Templates
Investor-Approved Valuation Models
MAC/PC Compatible, Fully Unlocked
No Expertise Is Needed; Easy To Follow
Guild Holdings Company (GHLD) Bundle
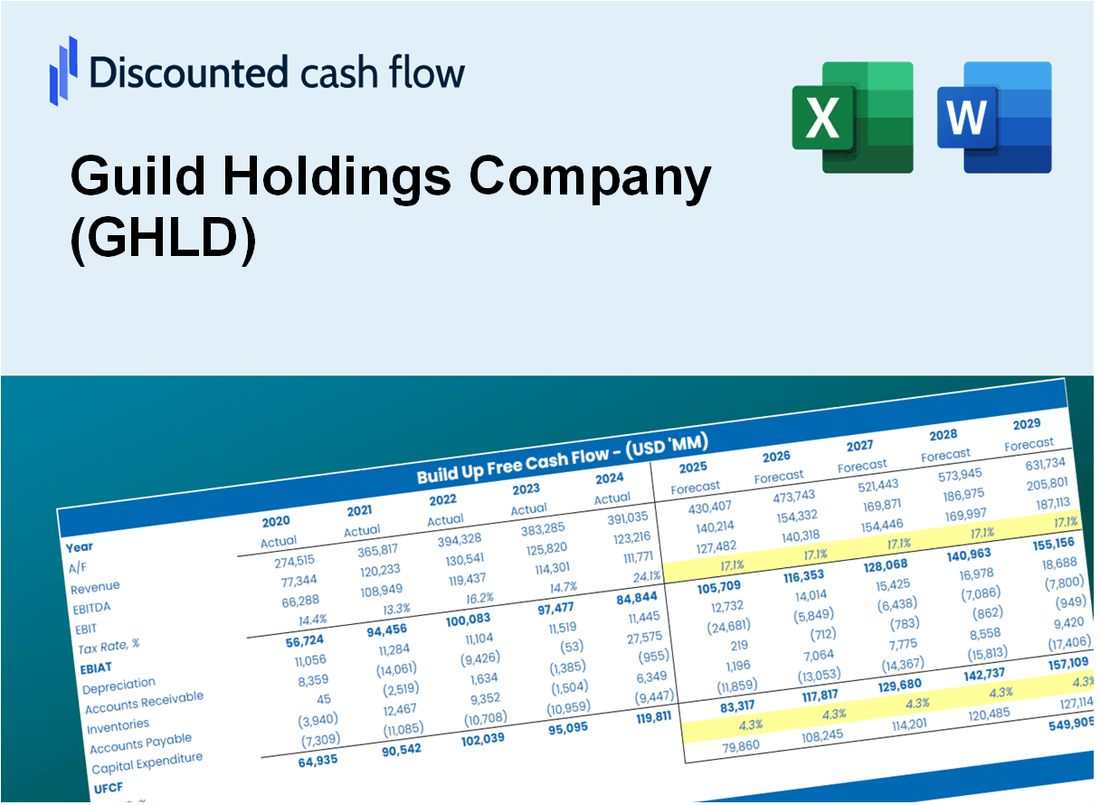
Bewerten Sie die finanziellen Aussichten der Guild Holdings Company (GLLD) wie ein Experte! Dieser (GHLD) DCF-Taschenrechner bietet vorgefüllte Finanzdaten und bietet Ihnen die Flexibilität, das Umsatzwachstum, WACC, Margen und andere kritische Annahmen zu ändern, um sich an Ihren Projektionen anzupassen.
What You Will Receive
- Customizable Excel Template: A fully adjustable Excel-based DCF Calculator featuring pre-filled real GHLD financials.
- Authentic Data: Historical data and future estimates (as indicated in the highlighted cells).
- Flexible Forecasting: Adjust forecast parameters such as revenue growth, EBITDA %, and WACC.
- Instant Calculations: Quickly observe how your inputs affect the valuation of Guild Holdings Company (GHLD).
- Professional Resource: Designed for investors, CFOs, consultants, and financial analysts.
- User-Friendly Interface: Organized for clarity and ease of navigation, complete with step-by-step guidance.
Key Features
- Comprehensive Financial Data: Guild Holdings Company’s historical financial statements and pre-filled projections.
- Customizable Parameters: Adjust WACC, tax rates, revenue growth, and EBITDA margins to fit your analysis.
- Real-Time Valuation: Observe Guild Holdings Company’s intrinsic value recalibrate instantly.
- Intuitive Visualizations: Dashboard graphs present valuation outcomes and essential metrics clearly.
- Designed for Precision: A professional-grade tool for analysts, investors, and finance professionals.
How It Works
- Download: Obtain the comprehensive Excel file featuring Guild Holdings Company's (GHLD) financial data.
- Customize: Tailor your forecasts by modifying revenue growth, EBITDA %, and WACC parameters.
- Update Automatically: Watch as the intrinsic value and NPV calculations refresh in real-time.
- Test Scenarios: Generate various projections and instantly analyze the outcomes.
- Make Decisions: Leverage the valuation insights to inform your investment approach.
Why Choose This Calculator for Guild Holdings Company (GHLD)?
- Accuracy: Utilizes real Guild Holdings financials to ensure precise data.
- Flexibility: Built to allow users to experiment and adjust inputs easily.
- Time-Saving: Eliminate the need to construct a DCF model from the ground up.
- Professional-Grade: Crafted with the expertise and usability expected at the CFO level.
- User-Friendly: Intuitive design makes it accessible for users without extensive financial modeling knowledge.
Who Should Use This Product?
- Professional Investors: Develop comprehensive and trustworthy valuation models for analyzing portfolios with Guild Holdings Company (GHLD).
- Corporate Finance Teams: Evaluate valuation scenarios to inform strategic decisions within the organization.
- Consultants and Advisors: Equip clients with precise valuation insights regarding Guild Holdings Company (GHLD).
- Students and Educators: Utilize real-world data to practice and instruct on financial modeling techniques.
- Real Estate Enthusiasts: Gain insights into how companies like Guild Holdings Company (GHLD) are valued in the real estate market.
What the Template Contains
- Comprehensive DCF Model: Editable template featuring in-depth valuation calculations.
- Real-World Data: Guild Holdings Company's (GHLD) historical and projected financials preloaded for analysis.
- Customizable Parameters: Modify WACC, growth rates, and tax assumptions to explore various scenarios.
- Financial Statements: Complete annual and quarterly breakdowns for enhanced insights.
- Key Ratios: Integrated analysis for profitability, efficiency, and leverage metrics.
- Dashboard with Visual Outputs: Graphs and tables presenting clear, actionable results.
Disclaimer
All information, articles, and product details provided on this website are for general informational and educational purposes only. We do not claim any ownership over, nor do we intend to infringe upon, any trademarks, copyrights, logos, brand names, or other intellectual property mentioned or depicted on this site. Such intellectual property remains the property of its respective owners, and any references here are made solely for identification or informational purposes, without implying any affiliation, endorsement, or partnership.
We make no representations or warranties, express or implied, regarding the accuracy, completeness, or suitability of any content or products presented. Nothing on this website should be construed as legal, tax, investment, financial, medical, or other professional advice. In addition, no part of this site—including articles or product references—constitutes a solicitation, recommendation, endorsement, advertisement, or offer to buy or sell any securities, franchises, or other financial instruments, particularly in jurisdictions where such activity would be unlawful.
All content is of a general nature and may not address the specific circumstances of any individual or entity. It is not a substitute for professional advice or services. Any actions you take based on the information provided here are strictly at your own risk. You accept full responsibility for any decisions or outcomes arising from your use of this website and agree to release us from any liability in connection with your use of, or reliance upon, the content or products found herein.